Bottom Line:
Market sentiment has been elevated with the recent rise in the market, though the aggregate picture is not yet extreme.
The Put/Call Ratio ($CPC):
The put call ratio measures the rate at which option traders are buying puts (bearish bets) compared to calls (bullish bets). This indicator is the most useful once it reaches extremes; when the market is topping investors are typically far too optimistic and when the market is bottoming they are far too pessimistic.
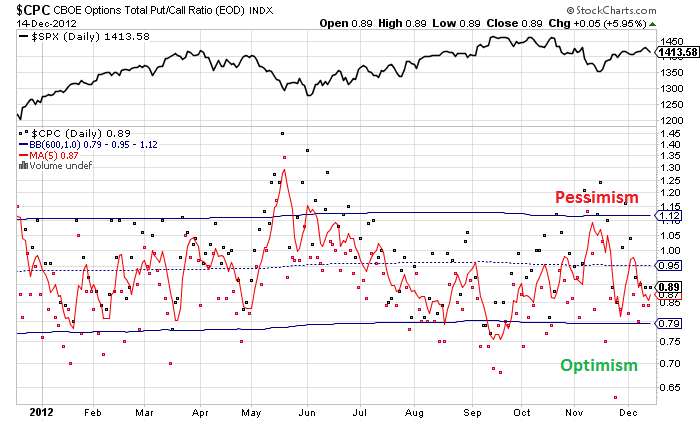
Analysis: After a brief dip to an optimistic extreme the put call ratio still is showing a call side bias. So despite the worries about "the cliff" traders are expecting some sort of positive resolution. The 5 day moving average is not at an extreme level where a high probability trade exists, but it does portray an atmosphere of optimism. One could argue there is a bearish divergence here as well.
Grade: Bearish
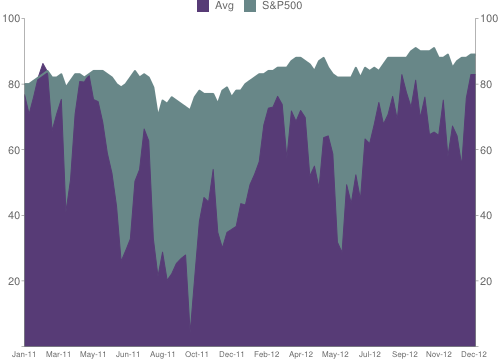
Investors Intelligence:
Investors Intelligence is a weekly poll that surveys newsletter writers. While they are professionals they too are subjected to group think, fear, greed, excitement and all the other broad range of emotions that can hamper objective market analysis. One interesting note; when the market is topping, peak optimism is generally reached before the final index price high. This indicator works best as a contrarian indicator when extremes are reached.
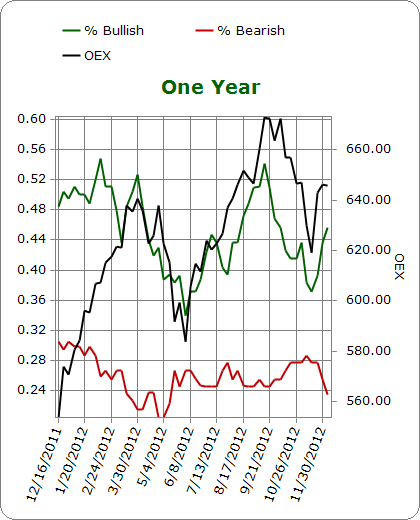
Analysis: Sometimes watching the market is like watching a parody of what reality should be. We can clearly see from this chart that news letter writers were too bullish at the top, and now that the market has rebounded, they are getting right back on board. This has been one of the fastest rebounds in percentage of bulls that I can remember. The good news (for bulls) is that the overall percentage of bullish respondents isn't at an extreme level. That bad news (for bulls) is that the percentage of bears is extremely low. The bull/bear ratio is at a worrisome level and that does not bode well for continued gains, though not at levels where a move lower is guarantee either.
Grade: Bearish (lightly). I'm giving this indicator a bearish grade based off the bull/bear ratio, which remains at elevated levels. Furthermore, there have been successively lower peaks in the ratio while the market has had higher highs, a generally bearish signal. I am however amending the grade with "lightly" since the outright level is not extreme.
The American Association of Individual Investors (AAII):
The AAII is a service that polls individual investors. Individuals tend to be more sensitive to price movements than the respondents for the Investors Intelligence survey, though the indicator works much the same way.This indicator works best as a contrarian indicator when extremes are reached.
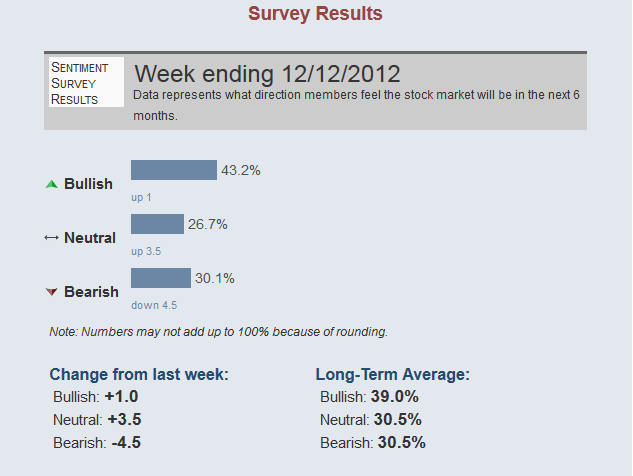
Analysis: Since the last update the AAII survey has quickly recovered from a bearish extreme. The rise has been very swift but the survey is far from being concerning, and is near the long term average.
Grade: Neutral
CFTC Commitment of Traders (S&P e-mini contract):
Every week the CFTC releases the aggregate futures positions of commercial hedgers, large traders, and small speculators. Since commercials tend to direct money flow, and small speculators tend to be terrible at market timing, it often pays to look at the juxtaposition of these groups.
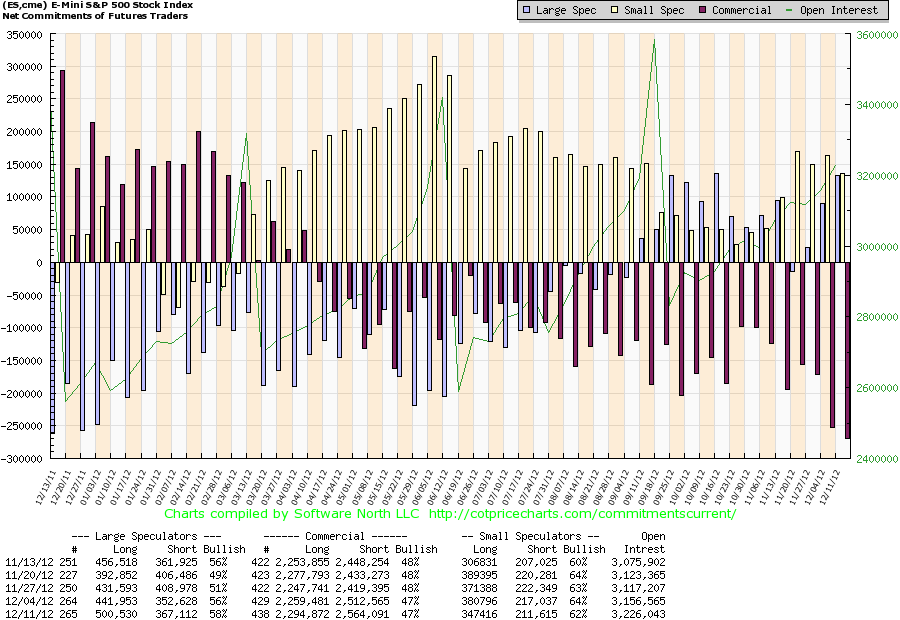
Analysis: In previous sentiment updates I've been pointing out the large short position built up by commercial hedgers in a broad array of index futures (Dow full and mini sized, S&P full and mini sized, Russell etc...). In the most recent decline the position has declined substantially. Looking at the S&P e-mini specifically which tends to be used by traders due to it's liquidity, hedgers are still carrying and have actually increased their short position. Speculators have been increasing their longs.
Grade: Bearish
National Association of Active Investment Managers (NAAIM):
The NAAIM polls active investment managers. While this poll hasn't been around very long, its short history tells us what we already suspected; professional managers tend to perform no better than most individuals, they're over-invested at tops, and caught short at bottoms. We can however turn their group think into something useful and use this data as a contrarian sentiment indicator.
Analysis: One of the more interesting surveys in this edition of the Sentiment Update; bears have absolutely capitulated. Just a week ago the largest reported bearish position was -125%, meaning the most convicted bear was 100% short plus 25% extra leverage. This week, the overall reporting of net longs have skyrocketed back to extreme levels, and the most convicted bull is now 200% long. Furthermore, that convicted bear has totally capitulated and is now flat (at 0%). There isn't a lot of data here unlike some of the other surveys which have been around for years, that said, it's been very interesting to watch and certainly warrants continuous study in the future.
Grade: Bearish
Short Interest:
In the last few years ETFs have become a popular instrument for individuals and institutions alike to quickly and easily get long or short the market. Their overall popularity has skyrocketed, so it pays to pay attention to short interest in some of the most popular index ETFs.
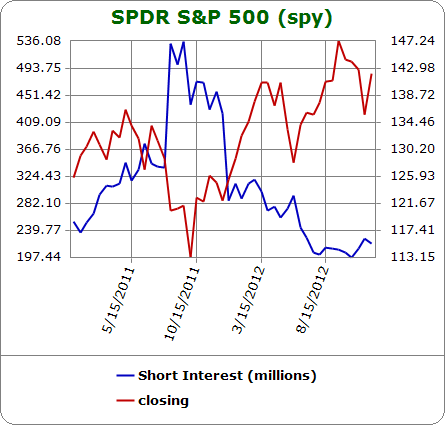
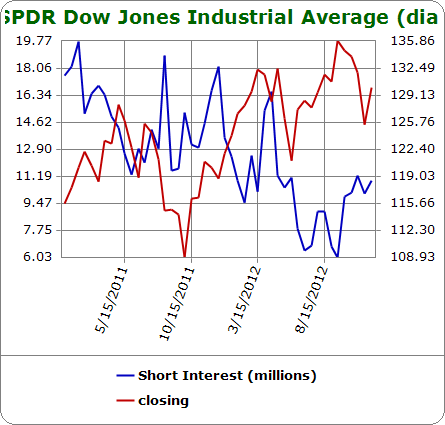
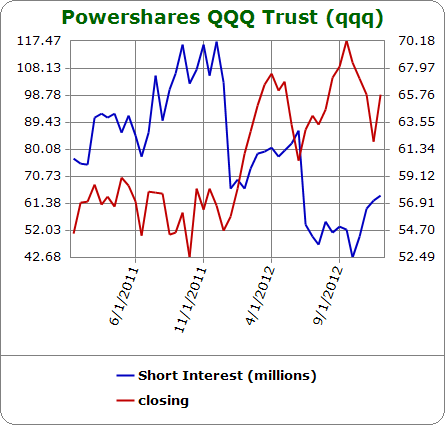
Analysis: Short interest has picked up as of late, not to surprising as the market has recently had a correction. Bigger picture, short interest remains near multi-year lows.
Grade: Bearish
Summary:
Grades:
- Bullish:0/6
- Neutral: 2/6
- Bearish: 4/6
We've looked at the options market, newsletter writers, individuals, the futures market, professional money managers, and ETF investors. While certain aspects of the indicators are elevated, other are simply in the neutral area. One thing I hate when making a trading decision is inconsistencies among indicators, I like a strong consensus, a consistent message. So while the aggregate message appears to be a mild overheating of market sentiment, there isn't a strong enough consensus here to make a long/medium term trading decision based of the sentiment data. I'll continue to watch, and report back next week after all the new sentiment data rolls in.
Good hunting
-Bill L.