Sentiment:
Last week on fast money, Gary Kaminsky, while attempting to challenge Angelo Mozilo for most ridiculously tanned CNBC guest, mentioned that percent bulls on the most recent AAII had dropped to 20.7%, the lowest reading since March 2009, and the markets would rally accordingly. It is true that the most recent reading in the AAII survey, percent bulls has dropped considerably, following the market downward. However, this is the kind of half ass, sound bite friendly, junk you hear on CNCB that can get you into trouble.
Sentiment is most useful when it reaches extremes, and extremes tends build for a long time. Furthermore, when sentiment is really important, you simply will not hear people talking about it on CNBC. For example, as painful as it is, I watch CNBC because I feel it provides a good temperature reading for market sentiment. In March 2009, when the market was bottoming, no one mentioned sentiment, or any other contrary indicators, everyone was 100% positive the market was heading lower. Flash forward to today, can you really say sentiment is as bad today as it was then? When the market crashing was on the cover of every major news paper? No, at true bottoms, no one cares how good contrary indicators look, they just know there is substantial downside left in the market.
Furthermore, the fact that bulls are looking for contrary evidence, to be bullish, tells me that there is still further downside. Markets are not rational. Social mood moves first, then markets, then rationales appear last. The fact that people are trying to use contrary indicators (inappropriately I might add), tells me that the overriding mood in the market is to still be bullish (first) then figure out why or rationalize (second).
Why do I say inappropriately? Short interest in the NYSE continues to shrink, the economy has recently been on magazine covers with BULLISH stories, a comparable survey, Investor's Intelligence, shows an nearly equal amount of bulls and bears (with more bulls I might add), the 5 day put call ratio hovers at the mean, the average analyst's expects the S&P to rise 18% by year end, etc. What "Super-Tan" Gary Kaminsky has done is look at a variety of indicators (ignore them is more likely) and pick the one that best fits his bull case. The Investor's Intelligence survey comes out the same day as the AAII survey, why choose the AAII numbers? - Because it best fits his bullish mainstream rational.
That was Last Thursday, I am watching Fast Money real time, and that jack ass literally just said, "the bias is to the downside." Unfreaking-believable. "I've always felt all along, you cannot have a recovery without the financials." He goes on to say that he speaks all the time with people in the real economy and they say this isn't a double dip because we never even recovered from the 2008 recession. Really? So two trading days ago we were about to start a similar rally to March of 2009, and now the market is going to tank? The market was up Friday, and down today, so no net change, and yet you have giant swing in expectations? It pains me that people with 401ks, IRAs and retirement savings put faith in the ridiculous CNBC personalities. Bottom Line: Taken as a whole, these indicators hardly say bearishness is at any kind of extreme.
The Stock Market:
Last Friday I wrote, "This was exactly what the market needed; a positive day investors can take with them into the weekend, alleviating some of the oversold oscillators, and removing some of the bearish sentiment. However, during bear markets ironically, rallies tend to be "stronger" and spikes in the advance/decline ratio and up/down volume ratio occurring near the end of rallies as bears give in, and bulls pour in, certain the worst is behind them." Today the market reversed Friday's rally with equally strong negative breadth, on no comparable "news."
Last Friday I also showed charts on two different time scales showing the same pattern (the flat), a fractal. Just as we broke down from the wedge in a larger daily period time scale, today we appear to have broken down out of the smaller version.
Chart 1 - SPX 5 Minute Bars - Breakdown
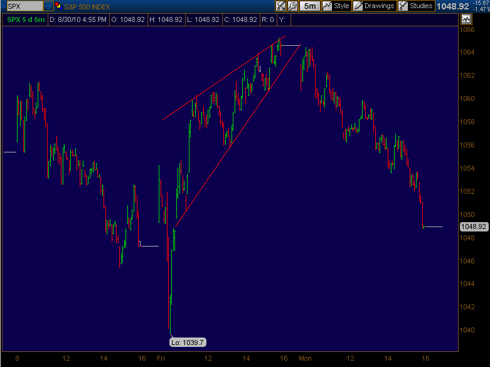
As I mentioned, wedges are particularly trade-able patterns, with a very high percentage breaking down, and retracing almost immediately. So a high probability, and fast move, it doesn't get much better than that. That being said, as of the close today, the decline didn't look particularly impulsive. However, as long as the market's trend remains down, and we stay within downward trend channels in daily and hourly time frames, I will give the market some leeway to see what develops.
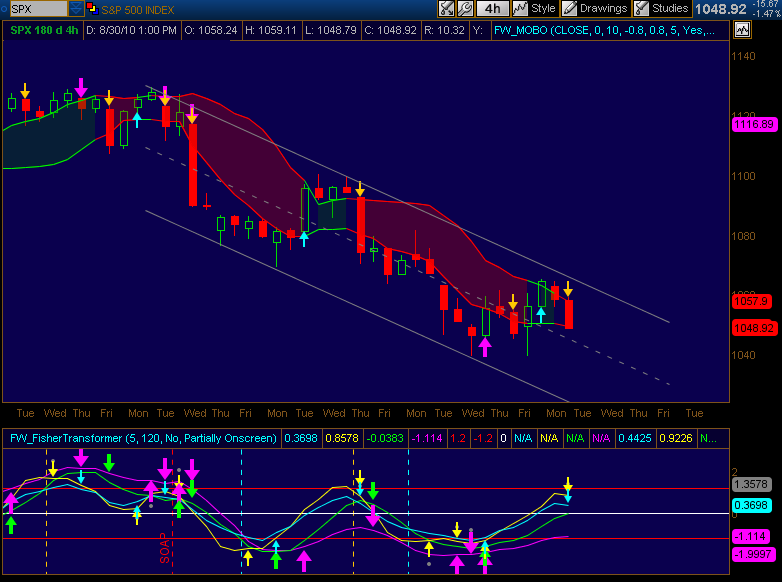
Chart 2 - SPX - 4 Hour Bars - Respecting The Channel
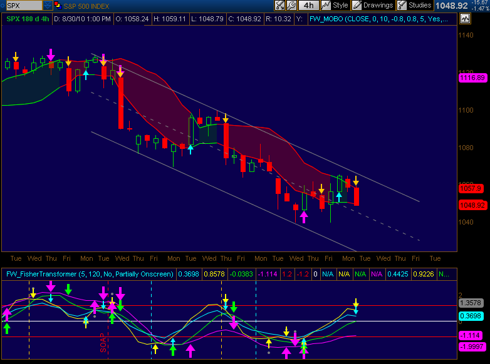
You can see the sell offs have been prolonged and setting new lows, with rallies being quickly reversed and failing to set new highs. If my current take on the market is correct I do not expect this channel to be broken to the upside before taking out the July 1st low.
Disclosure: Long SPY puts, Long BGZ.
Last week on fast money, Gary Kaminsky, while attempting to challenge Angelo Mozilo for most ridiculously tanned CNBC guest, mentioned that percent bulls on the most recent AAII had dropped to 20.7%, the lowest reading since March 2009, and the markets would rally accordingly. It is true that the most recent reading in the AAII survey, percent bulls has dropped considerably, following the market downward. However, this is the kind of half ass, sound bite friendly, junk you hear on CNCB that can get you into trouble.
Sentiment is most useful when it reaches extremes, and extremes tends build for a long time. Furthermore, when sentiment is really important, you simply will not hear people talking about it on CNBC. For example, as painful as it is, I watch CNBC because I feel it provides a good temperature reading for market sentiment. In March 2009, when the market was bottoming, no one mentioned sentiment, or any other contrary indicators, everyone was 100% positive the market was heading lower. Flash forward to today, can you really say sentiment is as bad today as it was then? When the market crashing was on the cover of every major news paper? No, at true bottoms, no one cares how good contrary indicators look, they just know there is substantial downside left in the market.
Furthermore, the fact that bulls are looking for contrary evidence, to be bullish, tells me that there is still further downside. Markets are not rational. Social mood moves first, then markets, then rationales appear last. The fact that people are trying to use contrary indicators (inappropriately I might add), tells me that the overriding mood in the market is to still be bullish (first) then figure out why or rationalize (second).
Why do I say inappropriately? Short interest in the NYSE continues to shrink, the economy has recently been on magazine covers with BULLISH stories, a comparable survey, Investor's Intelligence, shows an nearly equal amount of bulls and bears (with more bulls I might add), the 5 day put call ratio hovers at the mean, the average analyst's expects the S&P to rise 18% by year end, etc. What "Super-Tan" Gary Kaminsky has done is look at a variety of indicators (ignore them is more likely) and pick the one that best fits his bull case. The Investor's Intelligence survey comes out the same day as the AAII survey, why choose the AAII numbers? - Because it best fits his bullish mainstream rational.
That was Last Thursday, I am watching Fast Money real time, and that jack ass literally just said, "the bias is to the downside." Unfreaking-believable. "I've always felt all along, you cannot have a recovery without the financials." He goes on to say that he speaks all the time with people in the real economy and they say this isn't a double dip because we never even recovered from the 2008 recession. Really? So two trading days ago we were about to start a similar rally to March of 2009, and now the market is going to tank? The market was up Friday, and down today, so no net change, and yet you have giant swing in expectations? It pains me that people with 401ks, IRAs and retirement savings put faith in the ridiculous CNBC personalities. Bottom Line: Taken as a whole, these indicators hardly say bearishness is at any kind of extreme.
The Stock Market:
Last Friday I wrote, "This was exactly what the market needed; a positive day investors can take with them into the weekend, alleviating some of the oversold oscillators, and removing some of the bearish sentiment. However, during bear markets ironically, rallies tend to be "stronger" and spikes in the advance/decline ratio and up/down volume ratio occurring near the end of rallies as bears give in, and bulls pour in, certain the worst is behind them." Today the market reversed Friday's rally with equally strong negative breadth, on no comparable "news."
Last Friday I also showed charts on two different time scales showing the same pattern (the flat), a fractal. Just as we broke down from the wedge in a larger daily period time scale, today we appear to have broken down out of the smaller version.
Chart 1 - SPX 5 Minute Bars - Breakdown

As I mentioned, wedges are particularly trade-able patterns, with a very high percentage breaking down, and retracing almost immediately. So a high probability, and fast move, it doesn't get much better than that. That being said, as of the close today, the decline didn't look particularly impulsive. However, as long as the market's trend remains down, and we stay within downward trend channels in daily and hourly time frames, I will give the market some leeway to see what develops.
Chart 2 - SPX - 4 Hour Bars - Respecting The Channel
You can see the sell offs have been prolonged and setting new lows, with rallies being quickly reversed and failing to set new highs. If my current take on the market is correct I do not expect this channel to be broken to the upside before taking out the July 1st low.
Disclosure: Long SPY puts, Long BGZ.