Bottom Line:
Indicators are almost across the board bearish or showing a bearish divergence. Yesterday's reversal produced an outside day; at minimum I'm now expecting a multi-day correction. My long term work indicates there's a distinct possibility this is the beginning of a far bigger decline.
Indicators:
- Bullish: 0/20
- Neutral: 6/20
- Bearish: 14/20
- Aggregate Interpretation: Most of the indicators I watch are registering bearish extremes or could be interpreted as having a bearish divergence. Another interesting phenomenon is that while stocks are advancing, the up-down volume indicators are not (also visible in the TRIN figures). This means that while more stocks are advancing, they are doing so on lighter and lighter volume, while the stocks that are declining are doing so on heavy volume.
Examples:
Percentage of Stocks Above Their 20 DMA:
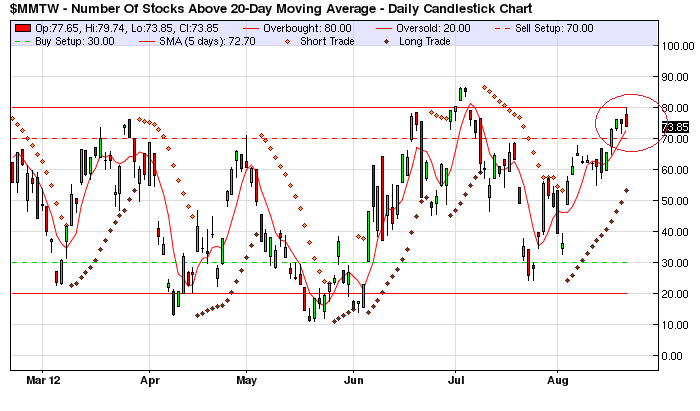
Notes: Both the one day close as well as the 5 DMA are above the "overbought" level of 70%.
NYSE McClellan Oscillator:
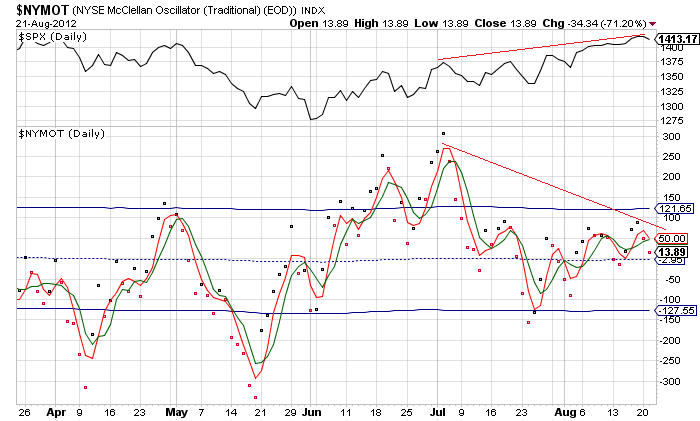
Notes: There's a bearish crossover of the 3 and 5 DMAs, though this is typically a stronger signal when it occurs above the "overbought" line.
NASDAQ McClellan Oscillator:
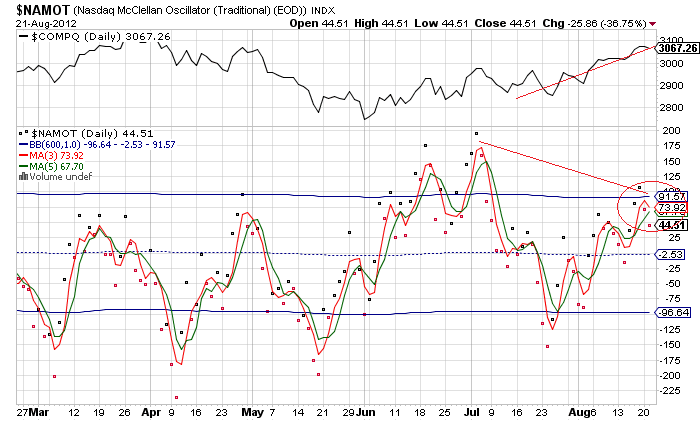
Notes: Overbought possibly showing a bearish divergence.
NYSE New Highs - New Lows:
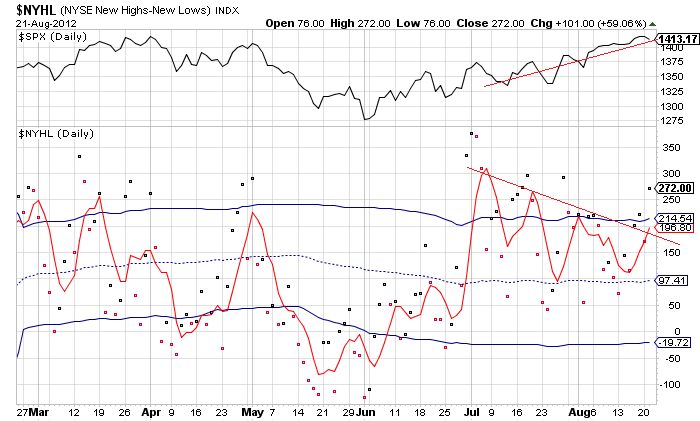
Notes: New highs-lows is showing an overbought reading as well as a bearish divergence; it appears the market peaked internally several weeks ago.
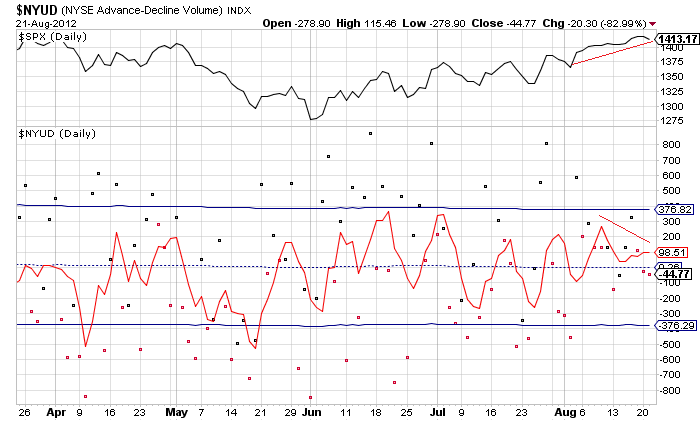
NYSE Advance - Decline Line:
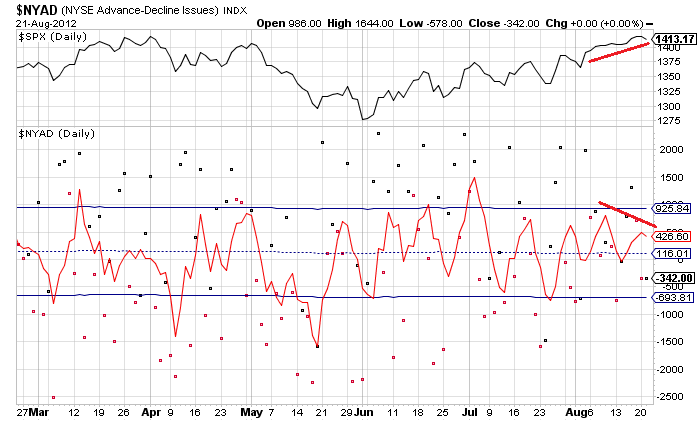
Notes: The AD line could be interpreted as neutral or showing a bearish divergence.
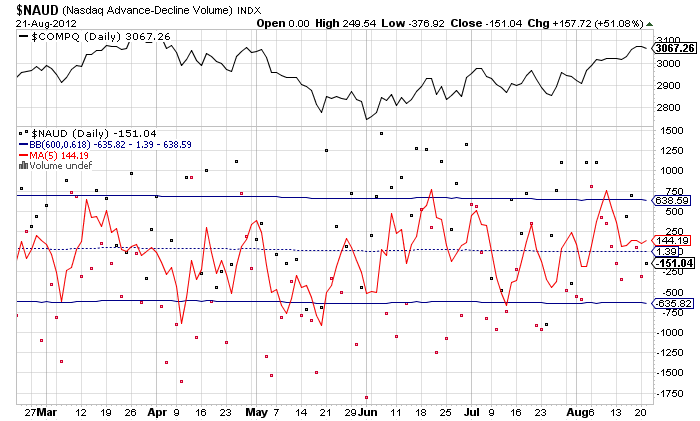
NASDAQ Advance - Decline Line:
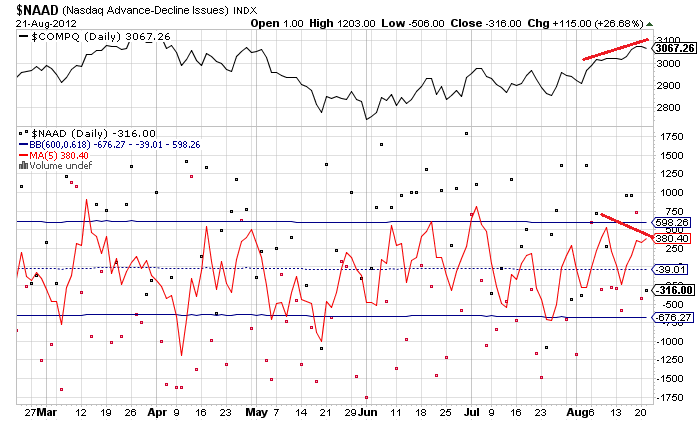
Notes:
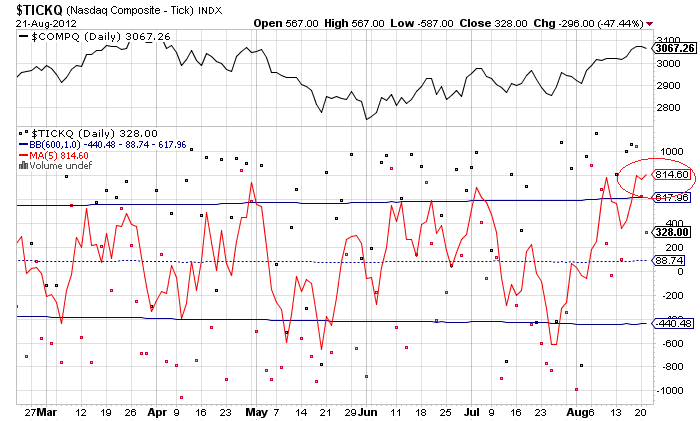
NYSE TICK:
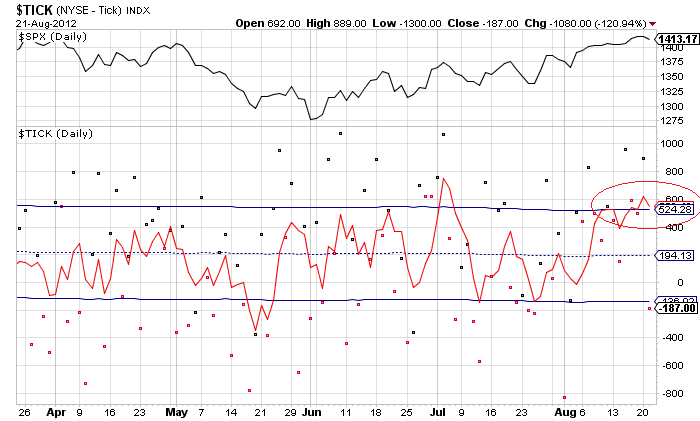
Notes:Very overbought.
NYSE TRIN
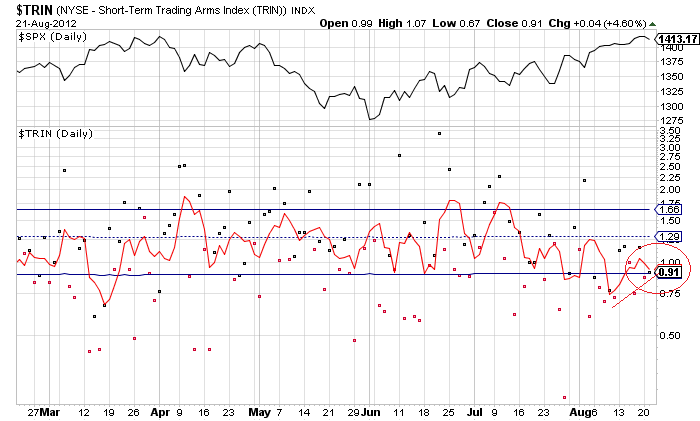
Notes: Overbought with a small divergence.
NASDAQ TICK:
NYSE Up - Down Volume:
NASDAQ Up - Down Volume:
NASDAQ TRIN:
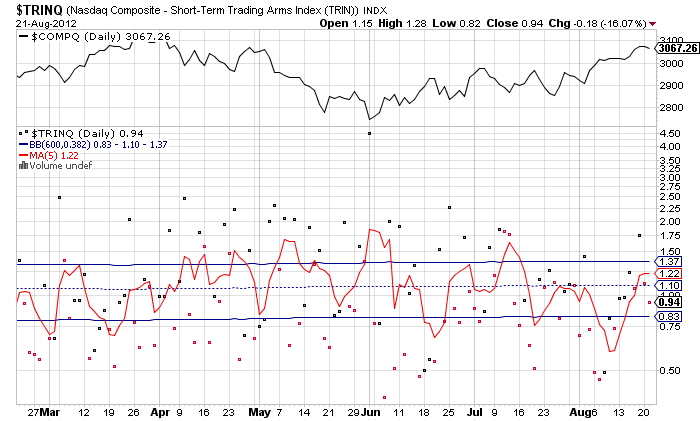
Notes: the up - down volume indicators as well as the TRIN, illustrate the mysteriously weak volume. The TRIN is neutral, and closer to oversold than overbought. With the advance decline line overbought, and the TRIN closer to oversold, this must mean that the small percentage of stocks that are declining are doing so under very heavy volume.
Put/Call Ratio:
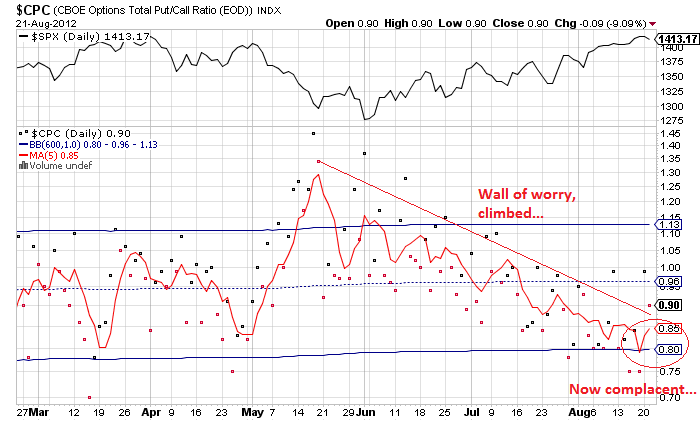
Notes: The put call ratio is showing a heavy skew toward calls. The VIX is at very low extremes...
Price Action:
SPX 15 min:
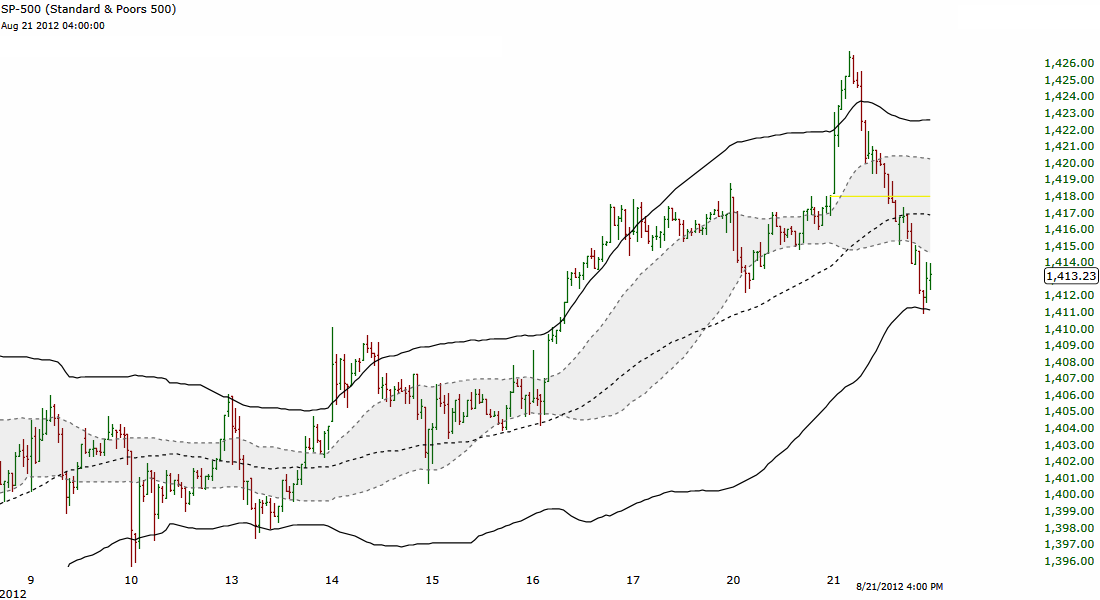
In the short term Prices have broken down below the momentum bands, meaning price momentum has switched from up to down. Now prices are touching the lower bounds of the wider less sensitive bands. In a bullish trend prices typically find some kind of support here, in a bearish trend prices should keep moving lower. So how prices react today will be important.
SPX Daily:
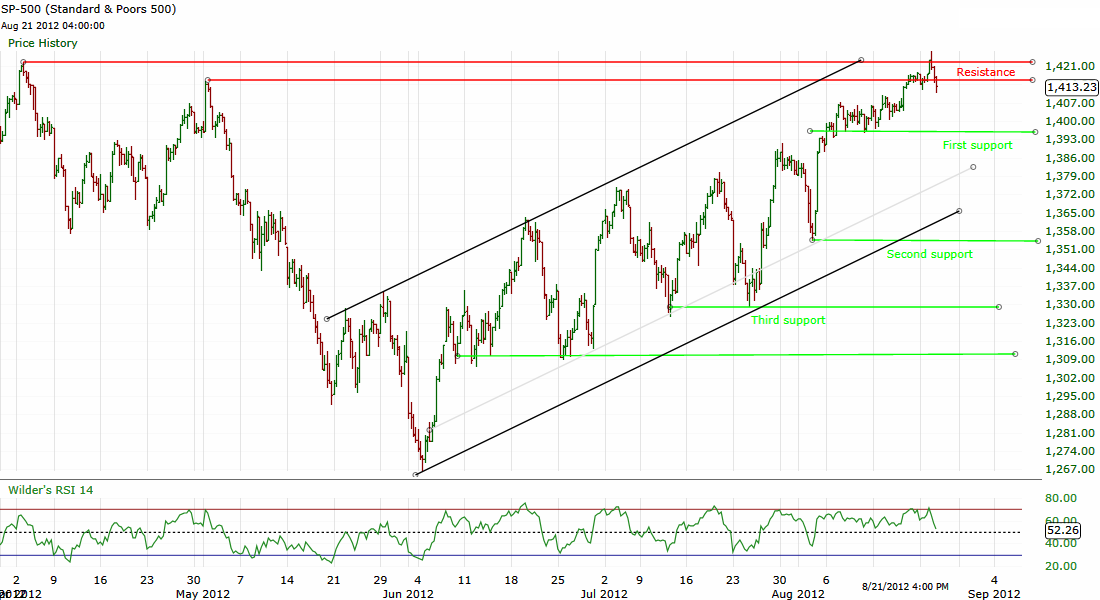
First support is at 1396, breaking second support at 1355 would do some serious technical damage to this chart (since this would mean that prices have also broken through the rising trend lines).
Summary:
Most of the indicators I watch are overbought or are showing a bearish divergence, indicating declining momentum. Meanwhile but to put/call ratio is showing that investors are no longer hedged and have reached a high degree of optimism. Thus, I'm try to take a shot at the short side here. Stop at an hourly close over 1420 SPX.
Good luck trading today,
-Bill L.
Disclosure: I am long SPXS.