Entering text into the input field will update the search result below

U.S. Corporate Credit Spread By Years To Maturity, October 3, 2014

Oct. 06, 2014 2:03 PM ETAGG, BND, BOND, HYG, JNK, DHF, DHY
Please Note: Blog posts are not selected, edited or screened by Seeking Alpha editors.

sbyytm

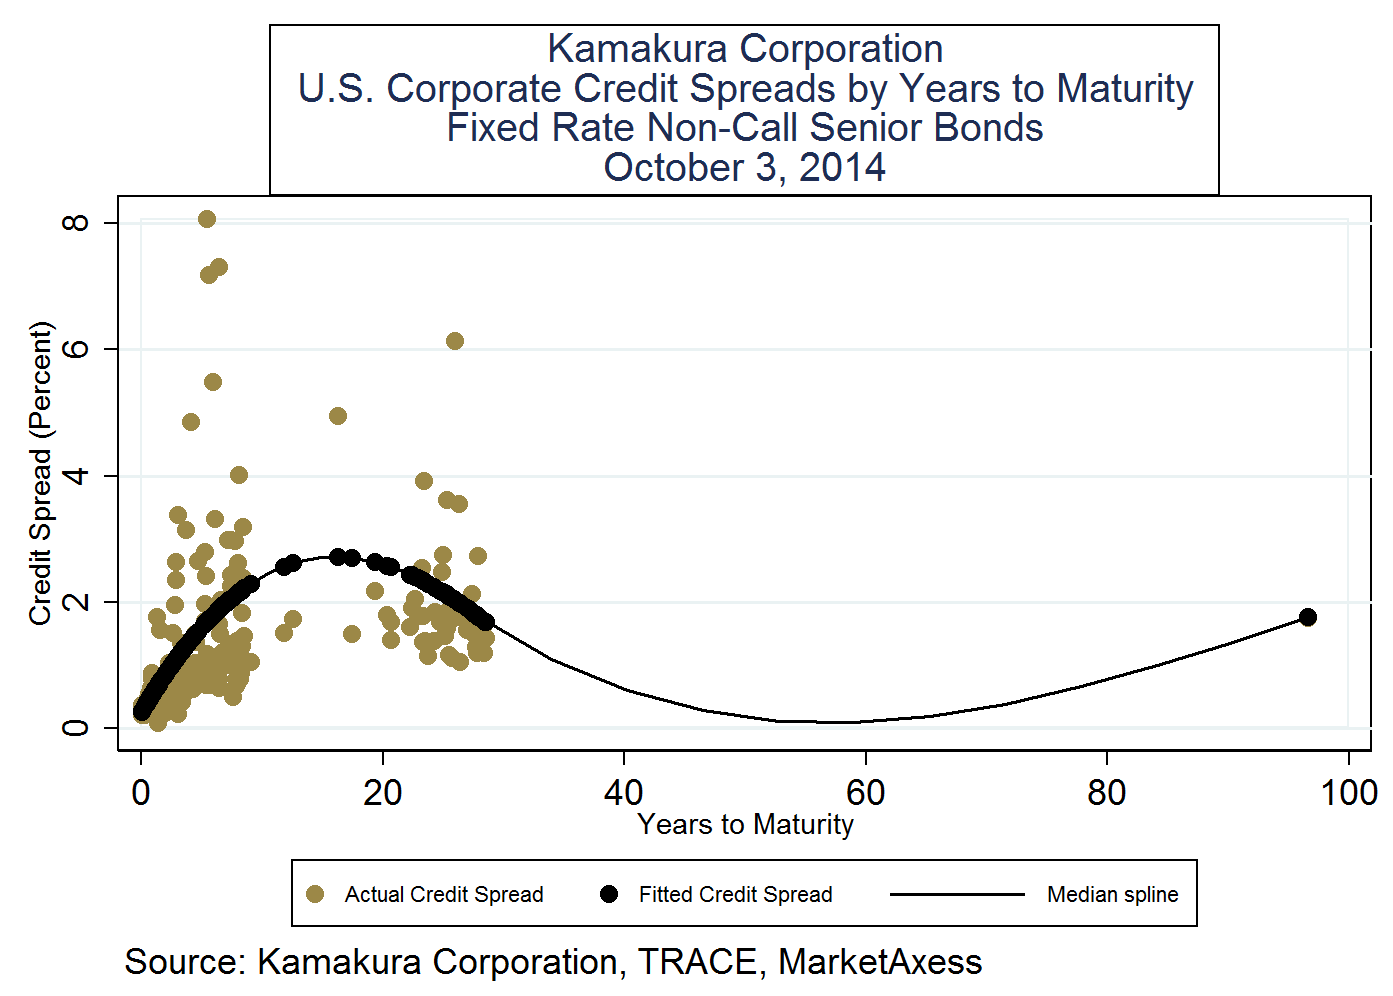
The graph shows the credit spread as a function of years to maturity on all corporate bond trades in the U.S. market which met the following conditions:

Coupon: Constant fixed rate until maturity

Maturity: 1 year or more

Trade volume: $5 million or more

Seniority: Senior debt

Callability: Non-call (except for "make whole" calls)

The credit spread is calculated by comparing the trade-weighted average yield to the matched maturity U.S. Treasury rate supplied by the U.S. Department of the Treasury to the Federal Reserve H15 statistical release. Calculations are by Kamakura Risk Information Services using data from TRACE. In a recent note, we explained why it is incorrect to use the common financial relationship that says credit spreads equal the default probability times (one minus the recovery rate). The graph above is additional evidence that this simple formula is incorrect. For more information please contact info@kamakuraco.com.

Analyst's Disclosure: The author has no positions in any stocks mentioned, and no plans to initiate any positions within the next 72 hours.

Seeking Alpha's Disclosure: Past performance is no guarantee of future results. No recommendation or advice is being given as to whether any investment is suitable for a particular investor. Any views or opinions expressed above may not reflect those of Seeking Alpha as a whole. Seeking Alpha is not a licensed securities dealer, broker or US investment adviser or investment bank. Our analysts are third party authors that include both professional investors and individual investors who may not be licensed or certified by any institute or regulatory body.

Recommended For You