The bankruptcy of Detroit brings new pressure on municipal bond investors and related exchange-traded funds like (HYD) (NUV) (PML) (PZA) (IIM) (NIO) (VMO) specializing in municipal bonds to heighten risk management and to hedge where appropriate. One potential tool in that regard is the single name credit default swap market, which is featured almost constantly in discussions of municipal entity credit risk. A recent example is "Traders Find Short Bets on Puerto Rico a Challenge," a Wall Street Journal blog. The author notes
"Default insurance on Puerto Rico, sold in the form of derivatives called credit-default swaps, is available from few dealer banks. The contracts also have barely traded because the protection is not available to buy in meaningful amounts and disclosures from the Commonwealth have been limited, some market participants said."
The purpose of this note is to bring clarity and precision to discussions of municipal credit default swaps by providing facts from the Depository Trust & Clearing Corporation trade warehouse. It is simply not the case that Puerto Rico credit default swaps have "barely traded." The DTCC data makes clear that Puerto Rico credit default swaps have never traded in any week since the DTCC began reporting weekly on trading volume beginning with the week ended July 16, 2010. In fact, only 11 municipal or sub-sovereign names have ever been reported as trades to the DTCC trade warehouse during the 2010-2014 period. This note explains the details.
Municipal Credit Default Swap Analysis
Kamakura Corporation has been reported semi-annually on the credit default swap trading volume reported by the DTCC. The most recent report from Kamakura Corporation analyzes the trading in 1,239 reference names in the 233 weeks ended December 26, 2014. Today's analysis is a further update of the August 15, 2013 Kamakura Corporation report on weekly credit default swap trading volume for sub-sovereigns and municipals among 1,144 reference names that had traded in the 155 weeks ended June 28, 2013. The study found, unfortunately, that (in the words of Gertrude Stein) "there is no there there."
The data used in this study consists of CDS trades reported by Depository Trust & Clearing Corporation ("DTCC") during the 233 week period ending December 26, 2014. The weekly trade information is from the Section IV reports from DTCC. The data is described this way in the DTCC document "Explanation of Trade Information Warehouse Data" (May, 2011):
"Section IV (Weekly Transaction Activity) provides weekly activity where market participants were engaging in market risk transfer activity. The transaction types include new trades between two parties, a termination of an existing transaction, or the assignment of an existing transaction to a third party. Section IV excludes transactions which did not result in a change in the market risk position of the market participants, and are not market activity. For example, central counterparty clearing, and portfolio compression both terminate existing transactions and re-book new transactions or amend existing transactions. These transactions still maintain the same risk profile and consequently are not included as 'market risk transfer activity.'"
As always, our emphasis is not on gross trading volume. As of January 10, 2014, dealer-dealer volume was 72.48% of the single name credit default swap market and it would be nearly costless for dealers to inflate gross trading volume by trading among themselves. Instead, we focus on "end user" trading where at least one of the parties to a trade is not a dealer. Accordingly, we make the following adjustments to the weekly number of trades reported by DTCC for each municipal and sub-sovereign reference name:
- We divide each weekly number of trades by 5 to convert weekly trading volume to an average daily volume for that week.
- From that gross daily average number of trades, we classify 72.48% of trades as "dealer-dealer" trades, using the average "dealer-dealer" share of trades in the DTCC trade warehouse as of January 10, 2014.
- The remaining 27.52% is classified as daily average "non-dealer" volume, the focus of the reporting below.
Important note: the trading averages for each reference name are reported only for those weeks in which there were trades. In other words, the averages are conditional on trades taking place.
Daily Non-Dealer Trading Volume for Municipal and Sub-Sovereign Reference Names
Of the 1,239 reference names for which DTCC reported credit default swap trades in the 233 week period, only 11 were sub-sovereigns of any type. No new reference names were traded in the last 26 weeks.
- Hong Kong Special Administrative Region
- State of California
- State of Florida
- State of Illinois
- State of Michigan
- State of New Jersey
- State of New York
- State of Ohio
- State of Texas
- The City of New York
- The Commonwealth of Massachusetts
There is no "Puerto Rico" on this list. The only other traded entities with "commonwealth" in the name are the Commonwealth of Australia and the Commonwealth Bank of Australia. The only entities with "Rico" in the name are Credit Agricole and Ricoh. This contrasts with the daily trades in the bonds of various Puerto Rico entities featured in this recent study. Note also that there is no Detroit entity on this list and not a single one of the California cities that have recently declared bankruptcy.
The total notional principal traded on all of these entities from July 2010 through December 26, 2014 is shown in this graph:
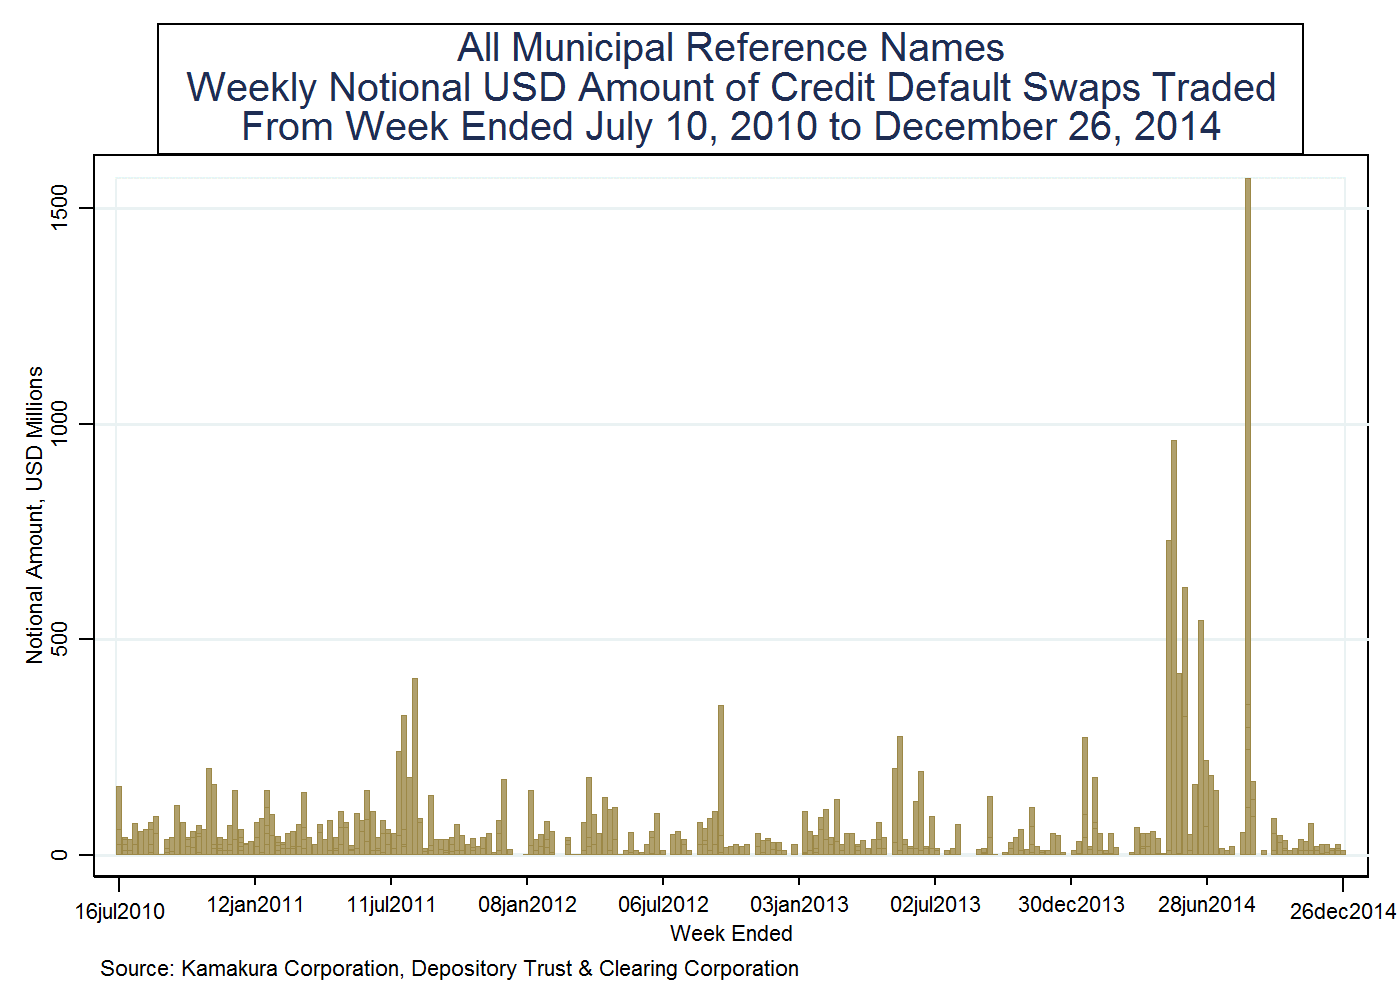
Volume has definitely increased in the last six months, hitting record levels for a number of the reference names. Those record levels, however, are still small compared to trading in sovereign entities.
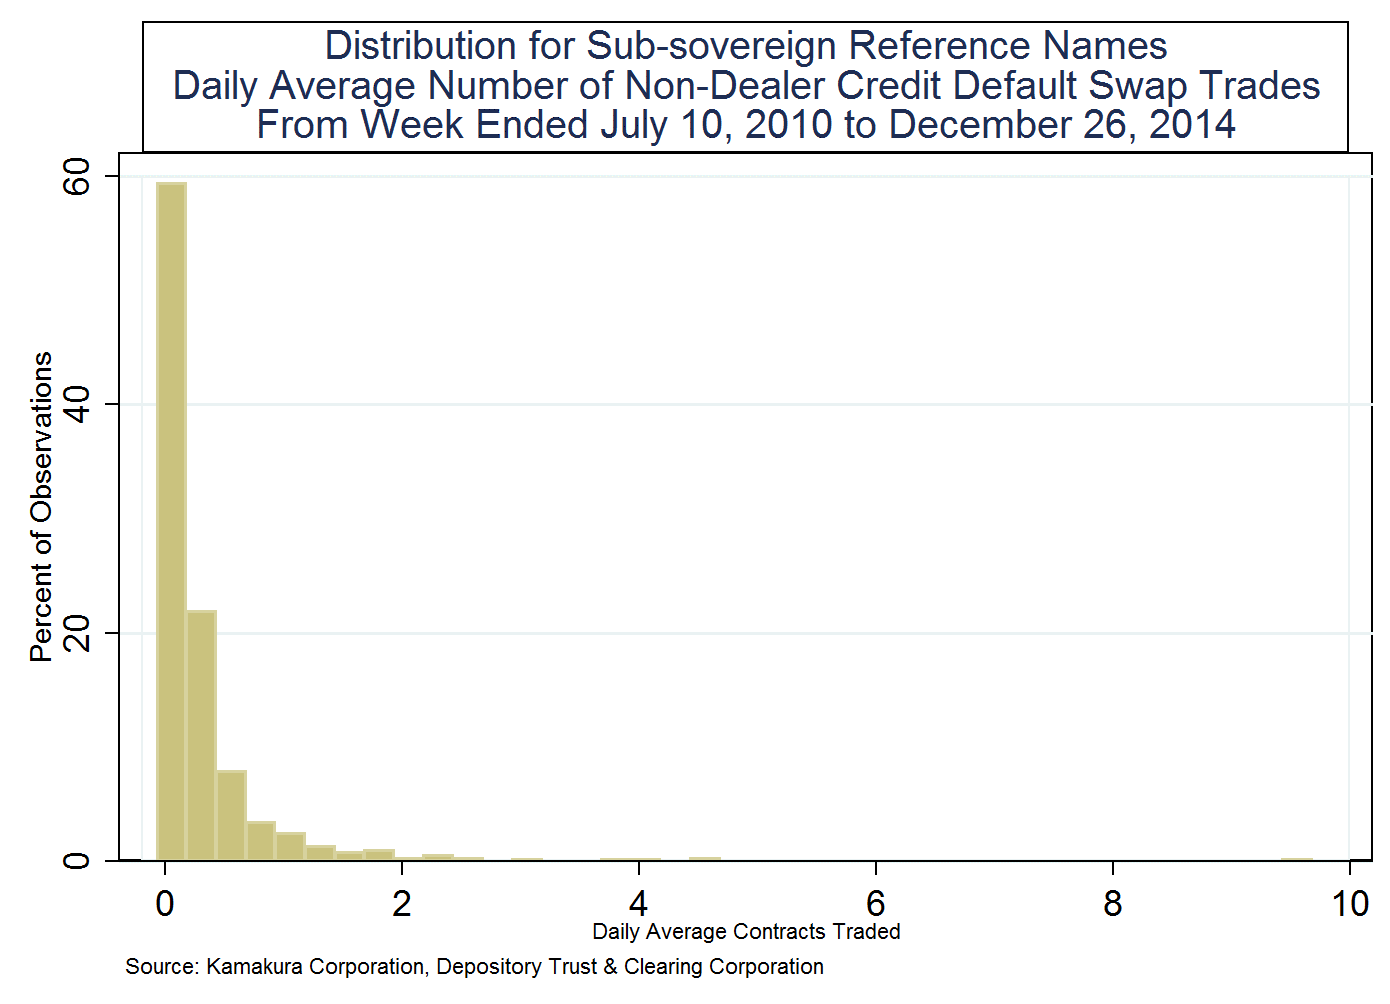
The distribution of the daily average non-dealer trading volume in these 11 municipal entities, using the weekly averages over the 233 week period, is given in this simple histogram:
Ten of the 11 reference names were in the United States and 9 of the 11 reference names were U.S. states. The only cities on which credit default swaps had any trades in the 233 weeks ended December 26, 2014 were the City of New York and Hong Kong. We can summarize the trading volume in these 11 reference names as follows:
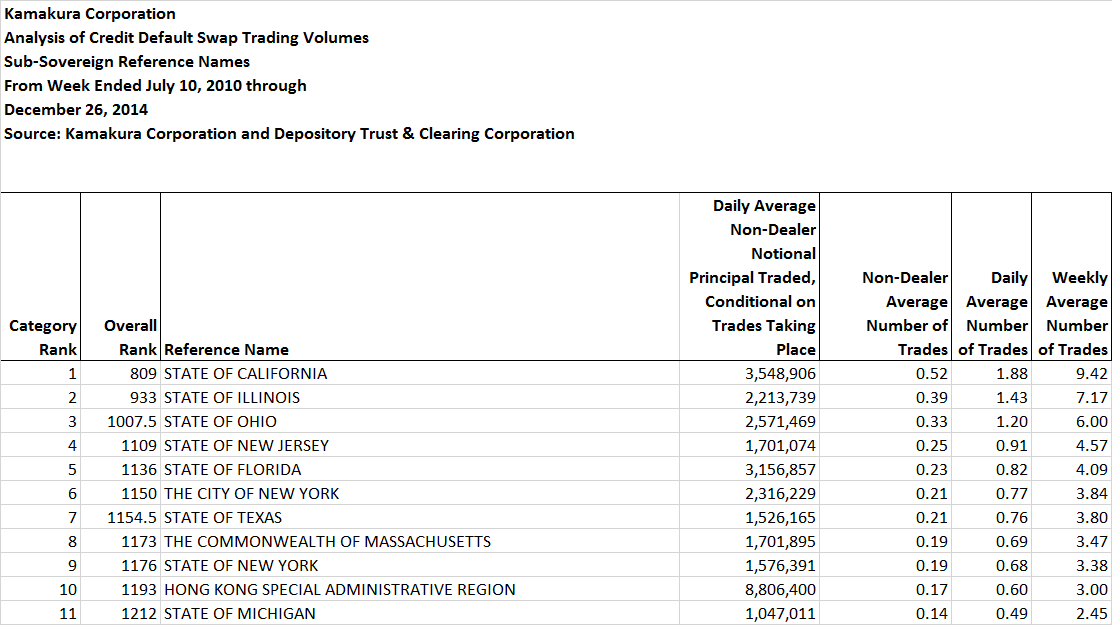
- The highest ranking reference name in terms of trading volume was State of California. The State of California ranked 809th of the 1,239 reference names reported by the DTCC.
- The median number of non-dealer trades per day on all 11 reference names over the 233 week period was 0.21 trades per day.
- Conditional on trades taking place, Hong Kong had the highest daily average non-dealer volume at $8.8 million.
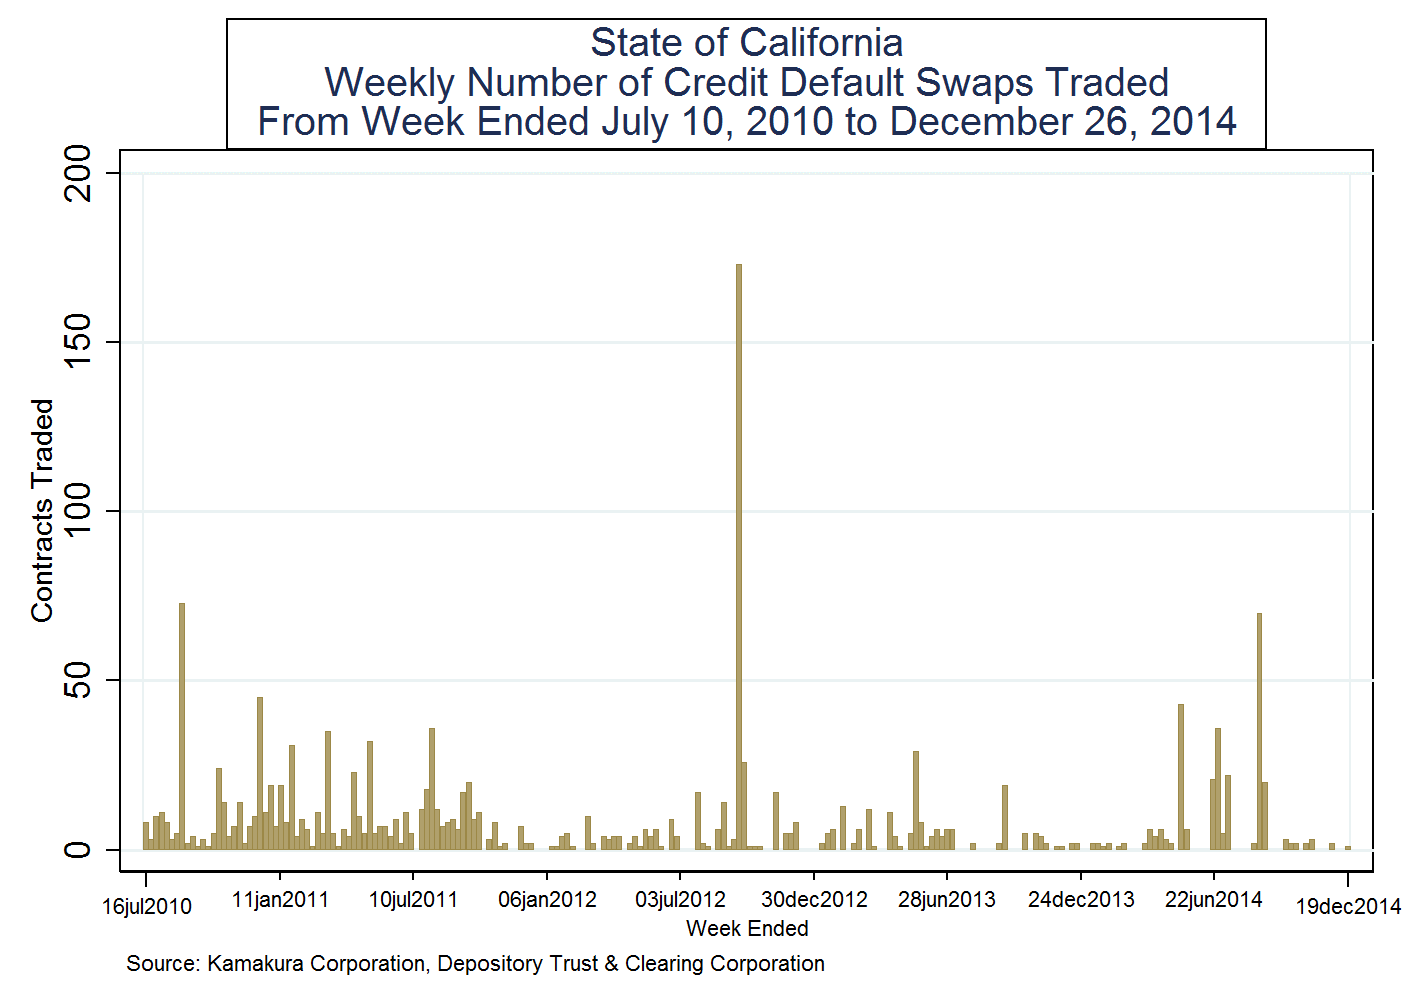
- The highest number of gross trades in one week was 173, which is the equivalent of 34.6 gross trades per day and 9.52 non-dealer trades per day. This data is for the State of California in the week ended September 21, 2012.
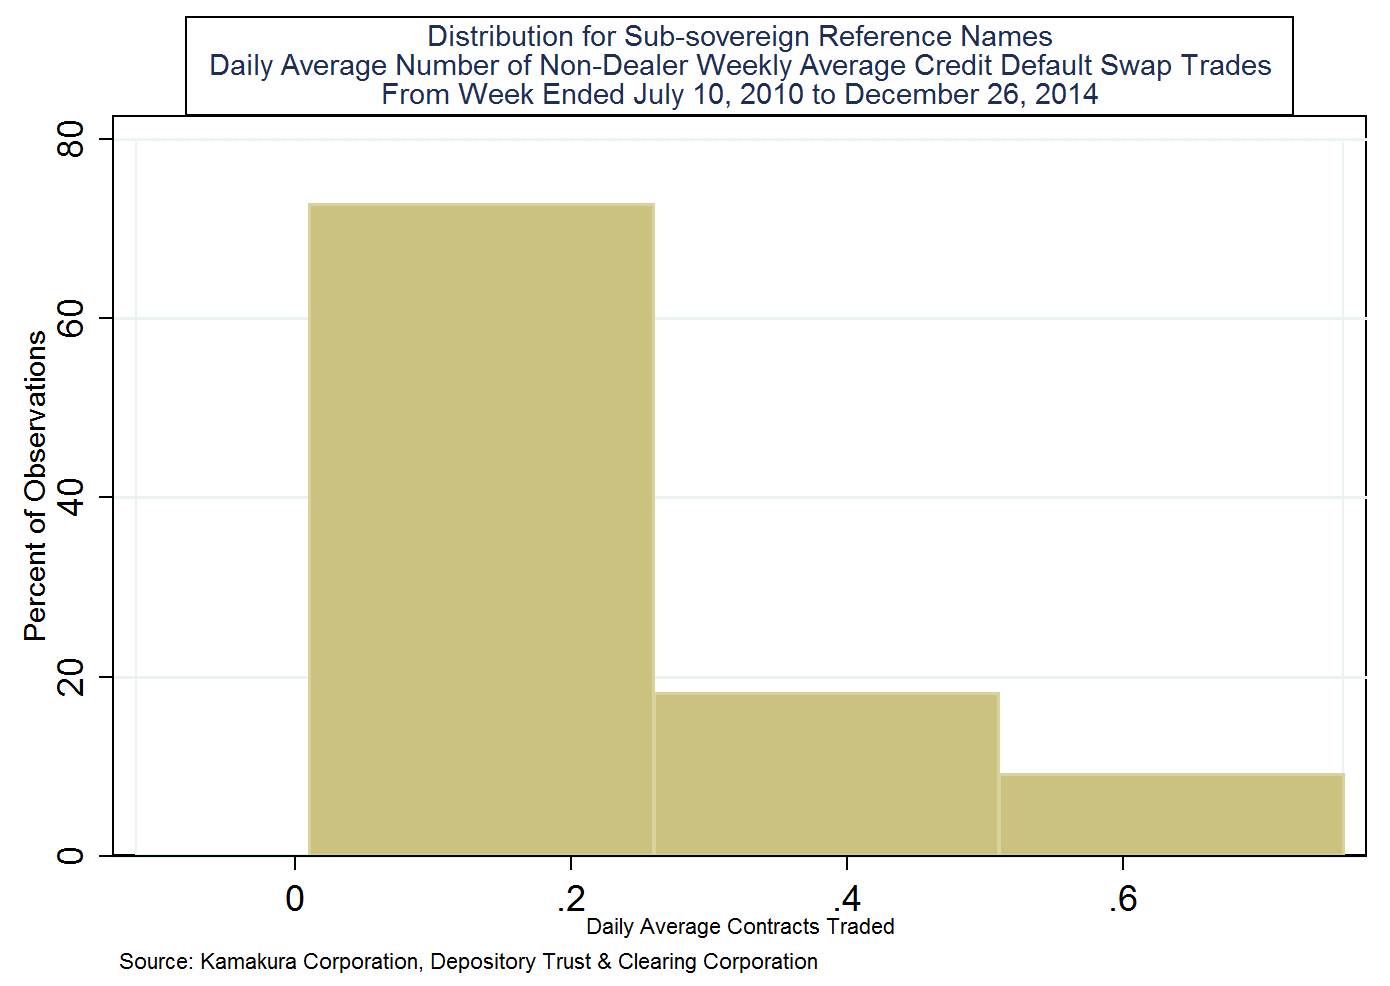
Over all of the weekly observations for the 11 entities on which trading was reported, the daily average trading volume is shown here:
Overall, there were only 739 observations in which one of these 11 entities had a credit default swap trade in the 233 weeks ending December 26, 2014. Out of the total number of potential observations, 11 x 233 = 2,563, the number of observations with no trades was 1,824 or 71.2% of the total. The 99th percentile in trading volume of the 739 non-zero observations was 2.48 non-dealer trades per day. The week by week gross trading volume (number of contracts) for the State of California over the full 233 week period ending December 26, 2014 is given in this chart:
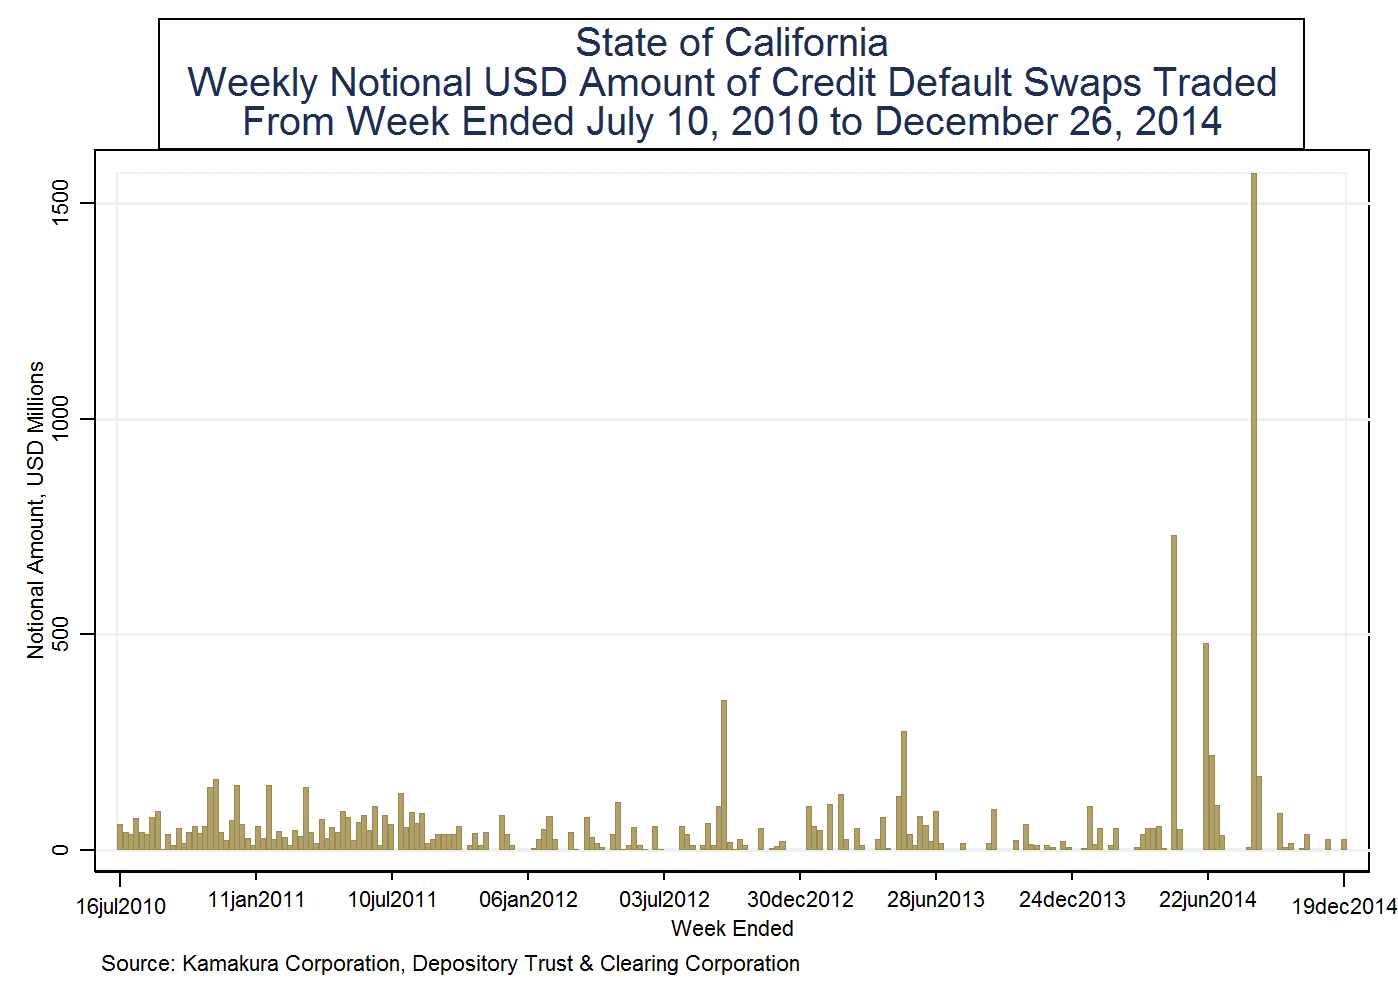
The weekly totals for gross notional principal trading in the State of California is shown in the next graph:
In spite of the readily available DTCC trading volume data, journalists and data vendors persist in implying there is actual trading volume in municipal reference names when in fact there is zero trading volume. On June 26, 2014, the following message was sent by CMA, a rating agency affiliate:
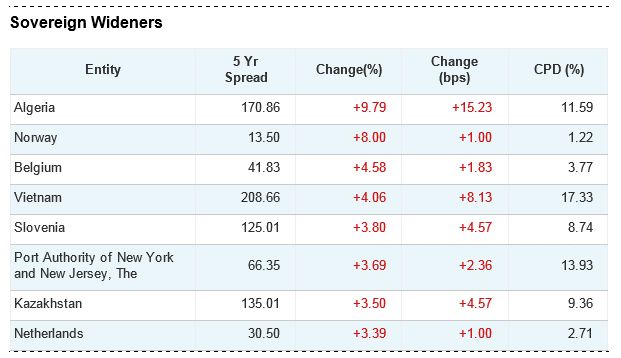
The message gives one the impression that there is trading in the Port Authority of New York and New Jersey, and yet there has never been a trade in credit default swaps of this reference name since DTCC began weekly reporting in the week ended July 16, 2010. Pricing indications with no disclosure of the related trading volume is a warning signal that no sophisticated market participant should ignore.
Donald R. van Deventer
Kamakura Corporation
January 12, 2015
Honolulu