Entering text into the input field will update the search result below

Distribution Of 5 Year US Treasury Yields 2015-2045

Feb. 10, 2015 12:37 PM ETTLT, TBF, IEF, SHY
Please Note: Blog posts are not selected, edited or screened by Seeking Alpha editors.

ust

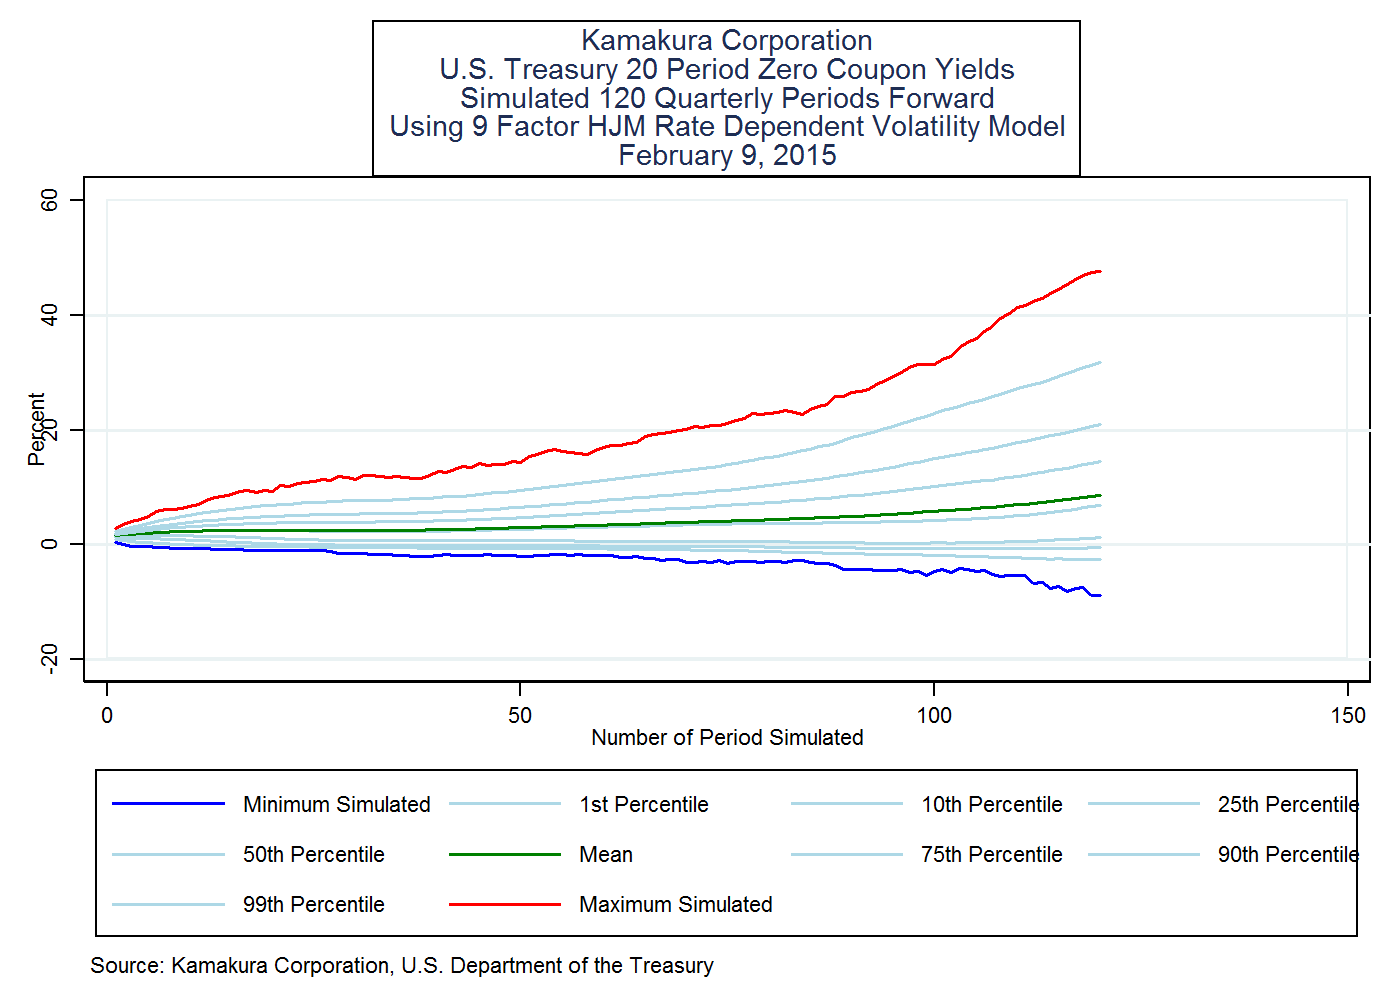
This projection from Kamakura Risk Information Services uses a 9 factor Heath Jarrow and Morton term structure model with rate-dependent volatility. The parameters are estimated with rate dependent volatility using quarterly data from 1962 to 2014 from the U.S. Department of the Treasury. 25,000 scenarios were generated quarterly for 30 years from the U.S. Treasury yield curve on February 9, 2015. In light of bond levels observed in the Euro zone, Japan and Hong Kong, parameters were set to allow negative rates to occur.

Analyst's Disclosure: The author has no positions in any stocks mentioned, and no plans to initiate any positions within the next 72 hours.

Seeking Alpha's Disclosure: Past performance is no guarantee of future results. No recommendation or advice is being given as to whether any investment is suitable for a particular investor. Any views or opinions expressed above may not reflect those of Seeking Alpha as a whole. Seeking Alpha is not a licensed securities dealer, broker or US investment adviser or investment bank. Our analysts are third party authors that include both professional investors and individual investors who may not be licensed or certified by any institute or regulatory body.

Recommended For You