BIDU announced earnings and guidance Thursday (2/16)
that did not impress investors. As a result, stock price
went down 3.5% on Friday. S&P 500 index was up 0.2%
Friday while XLK ETF was unchanged and QQQ ETF was
down 0.3%.
Closer look at Friday's intraday price action shows a few
signs of weakness.
First, Friday's volume was huge, 206% of 10-day average.
Down on huge volume is a sign of distribution by large
investors.
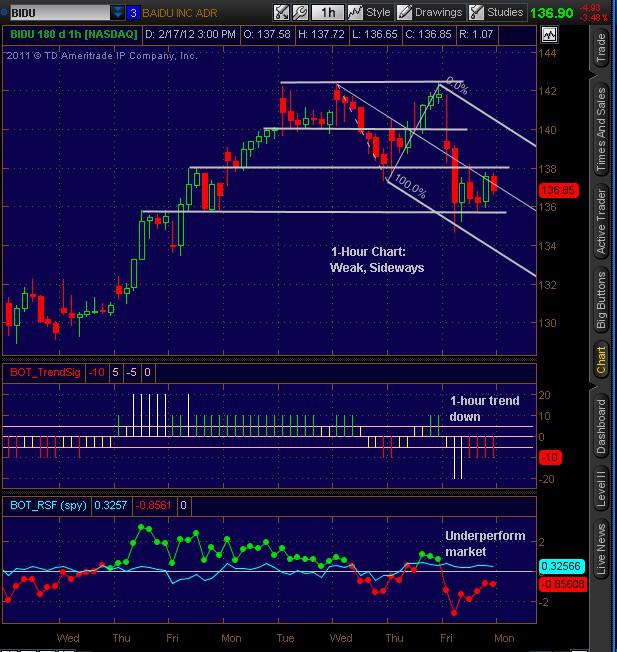
The following 1-hour chart shows a downtrend channel.
BIDU consolidated between $135 and $138 area for the
last five hours and as expected, intraday price action
shown on the second pane was weaker than S & P 500
index for Friday.
BIDU therefore appears to begin to turn down on
intraday basis. Next couple of days' price actions would
tell us if Friday's intraday weakness is the beginning
of a more prolonged downturn or just a knee-jerk
reactions to earnings announcement.
Disclosure: I have no positions in any stocks mentioned, and no plans to initiate any positions within the next 72 hours.