Last week we found a pretty profound (we thought) relationship between two of our momentum indicators: M4 (which designates overbought and oversold levels the reverse of what one would expect: 90+ oversold; 10+ overbought) and M4 Sum Plus 7, which is an average of the same root-system as M4. Both indicators are useful alone; but then we laid the one on top of the other. When M4 (see the brown line in the chart below, middle pane) rises above M4 Sum Plus 7, selling comes in to the market; when M4 falls below M4 Sum Plus 7, buying comes in.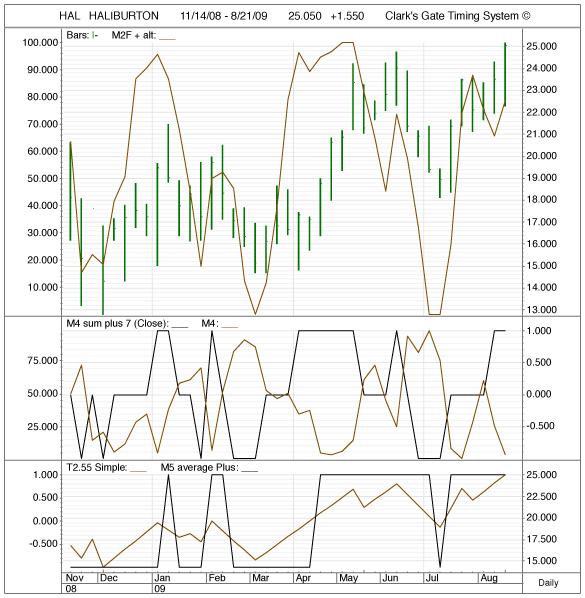
Ok, so our next plan was to build a formula that would measure these equations against one another, to see if we could make a trading system out of this visual correlation. M4 and M4 Sum Plus 7 needed to be normalized, so they could be compared. Normalizing them was not very successful -- so we used M4 Sum Plus 7 and made an anti-indcator, a mirror-image indicator, to test against the original. We seemed to have found something useful.
When our long-term (T3) and intermediate-term (T11) trend indicators are positive and our Anti-M4 Sum Plus 7 indicator is less than M4 Sum Plus 7, we get a buy signal. We sell when our anti-indicator is above the M4 Sum Plus 7 and our intermediate-term trend is negative. This bleeds out one day dips, or insignificant moves in the indicators. We use the reverse logic for short-selling.
We had a few issues come up on our screen as Buys for the last few days (daily trading) or weeks (weekly trading). HAL was one, weekly trade, giving a buy signal on the week of 7/17/09.
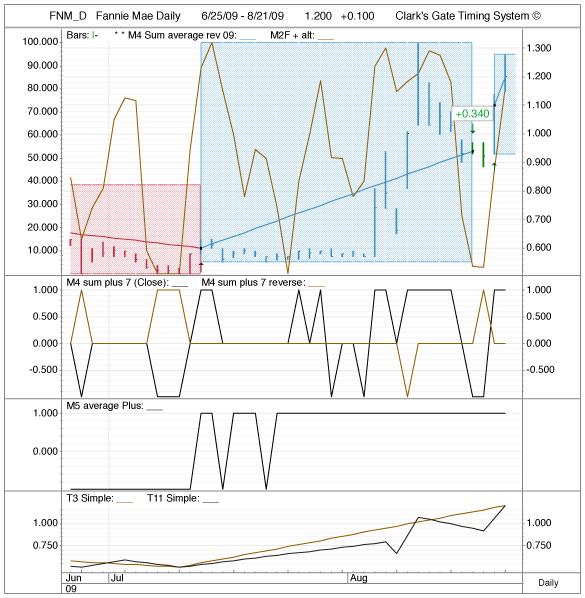
FNM, Fannie Mae, gave a buy signal on the daily charts two days ago, Thursday, 16 August. Imagine our pleasant surprise when we heard that FNM was up 50% today for no apparent reason.
And BJS, BJServices, on weekly charts, which is giving a buy signal for today.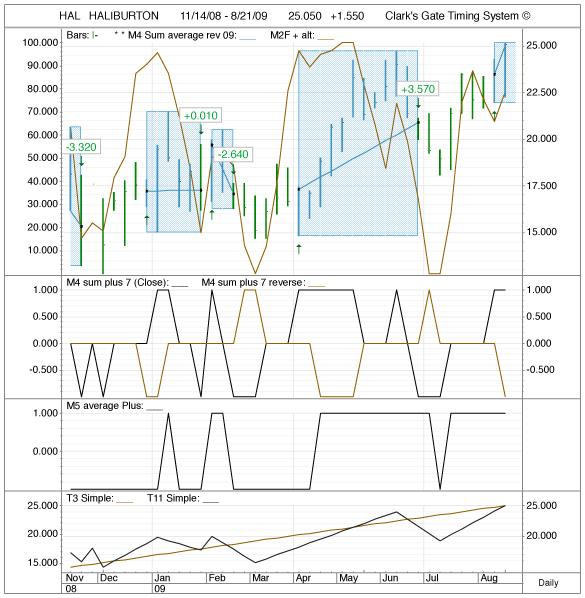
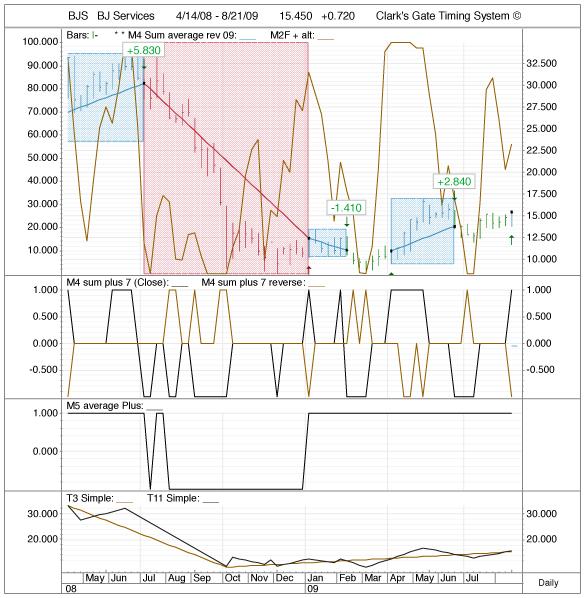
We need to do more extensive trading of this system; but our early investigations are promising.
MJClark
Clark's Gate Timing System ©
CGTS: New Trading System
Seeking Alpha's Disclosure: Past performance is no guarantee of future results. No recommendation or advice is being given as to whether any investment is suitable for a particular investor. Any views or opinions expressed above may not reflect those of Seeking Alpha as a whole. Seeking Alpha is not a licensed securities dealer, broker or US investment adviser or investment bank. Our analysts are third party authors that include both professional investors and individual investors who may not be licensed or certified by any institute or regulatory body.