Clark's Gate Timing System
Wednesday 9 September 2009: Some new and some monthly index charts.
This is deflation in action: falling prices that are, in effect, a transfer of wealth from landlords, goods producers and retailers to consumers.
INDEX VIEW
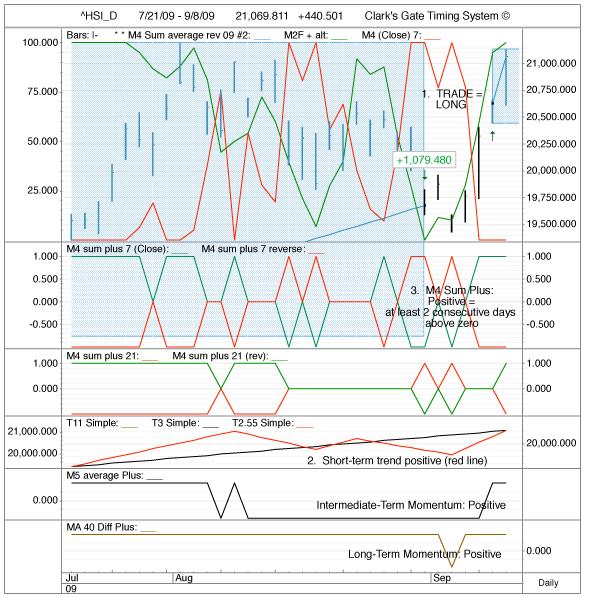
We can't print 20 index charts each day. But we can run a table that attempts to represent some of the data we show in the charts. Not much change to report in the indexes. Stock prices are at a transition; and they are trying to decide if they want to correct, or continue to climb. Long Indexes: AORD Australia, DJTransports, FTSE England, HSI China Hong Kong, HUI Gold Stocks, KS11 South Korea, SMSI Spain, TWII Taiwan, XAU Gold Stocks, IAU Gold. The only SHORT is the US Dollar (UUP)
KEY: 'TRADE" = current position using M4 Sum Plus Trade System. "TREND" = short-term trend DIRECTION: above 0 is positive; below 0 is negative. "M4 +" = issues with at least 2 consecutive days of positive M4 Sum Plus will register a 1. 'M4 -" = issues with at least 2 consecutive days of negative M4 Sum Plus will register a 1. M4 Sum Plus is a VERY short-term momentum indicator. "INT MOM" = M5 Average Sum Plus, which is an intermediate-term momentum indicator: 1 is positive; -1 is negative. "LTERM MOM" = MA 40 Sum Plus, which is a long-term momentum indicator: +1 is positive; -1 is negative.
| DAILY INDEXES | ||||||
| 9-Sep | TRADE | TREND | M4 + | M4 - | INT MOM | LTERM MOM |
| ^AORD_D | Long | 19 | 0 | 0 | 1 | 1 |
| ^BKX_D | Flat | 1 | 0 | 0 | -1 | 1 |
| ^BVSP_D | Flat | 7 | 0 | 0 | 1 | 1 |
| ^DJI_D | Flat | -12 | 0 | 0 | 1 | 1 |
| ^DJT_D | Long | 53 | 1 | 0 | 1 | 1 |
| ^DRG_D | Flat | -1 | 0 | 0 | -1 | 1 |
| ^FCHI_D | Flat | 36 | 0 | 0 | 1 | 1 |
| ^FTSE_D | Long | 20 | 1 | 0 | 1 | 1 |
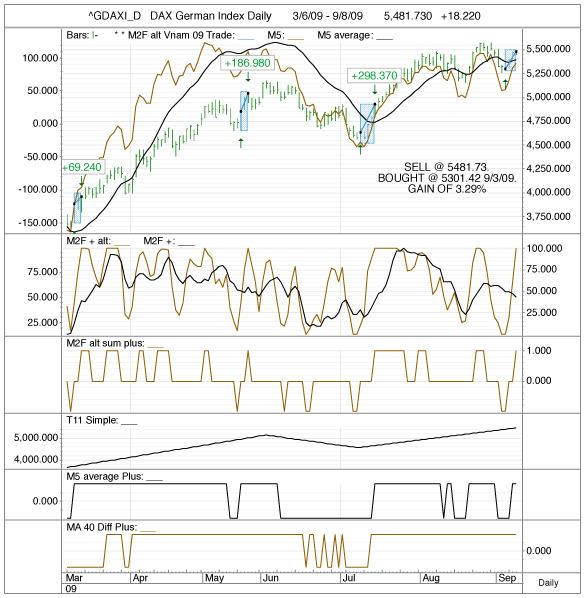
| ^GDAXI_D | Flat | 60 | 0 | 0 | 1 | 1 |
| ^GSPC_D | Flat | -1 | 0 | 0 | 1 | 1 |
| ^HGX_D | Flat | -1 | 0 | 0 | -1 | 1 |
| ^HSI_D | Long | 378 | 1 | 0 | 1 | 1 |
| ^HUI_D | Long | 15 | 1 | 0 | 1 | 1 |
| ^JPN_D | Flat | 0 | 0 | 0 | -1 | 1 |
| ^KS11_D | Long | 5 | 0 | 0 | 1 | 1 |
| ^N225_D | Flat | -17 | 0 | 0 | -1 | 1 |
| ^NDX_D | Flat | 20 | 0 | 0 | 1 | 1 |
| ^OEX_D | Flat | 0 | 0 | 0 | 1 | 1 |
| ^RUT_D | Flat | 7 | 0 | 0 | 1 | 1 |
| ^SMSI_D | Long | 10 | 1 | 0 | -1 | 1 |
| ^SOXX_D | Flat | 6 | 0 | 0 | 1 | 1 |
| ^SSEC_D | Flat | 44 | 1 | 0 | -1 | -1 |
| ^SSMI_D | Flat | 23 | 0 | 0 | -1 | 1 |
| ^TWII_D | Long | 55 | 1 | 0 | 1 | 1 |
| ^TYX_D | Flat | 0 | 1 | 0 | 1 | -1 |
| ^UTY_D | Flat | -1 | 0 | 0 | -1 | 1 |
| ^VIX_D | Flat | -1 | 0 | 0 | -1 | -1 |
| ^XAU_D | Long | 5 | 1 | 0 | 1 | 1 |
| ^XCI_D | Flat | 0 | 0 | 0 | 1 | 1 |
| ^XOI_D | Flat | 1 | 0 | 0 | 1 | 1 |
| DBO_D | Flat | 0 | 0 | 0 | -1 | -1 |
| IAU_D | Long | 0 | 1 | 0 | 1 | 1 |
| UUP_D | Short | 0 | 0 | -1 | -1 | -1 |
Illustrating HSI_D (see above):
New Positions for Today
| Tuesday | |||||
| 9/8/09 | |||||
| M2F alt Trading System | |||||
| EXIT | Close @ | Trade | Open @ | Gain | Date Entered |
| ^FCHI_D | 3,660.96 | Exit Long | 3553.51 | 2.94% | 9/3/09 |
| ^FTSE_D | 4,947.34 | Exit Long | 4851.7 | 1.93% | 9/4/09 |
| ^GDAXI_D | 5,481.73 | Exit Long | 5301.42 | 3.29% | 9/3/09 |
| ^DJT_D | 3,766.80 | Exit Long | 3667.16 | 2.65% | 8/31/09 |
| ADBE_D | 32.51 | Exit Long | 31.42 | 3.35% | 8/31/09 |
| BEN_D | 95.61 | Exit Long | 93.34 | 2.37% | 9/3/09 |
| EWC_D | 24.62 | Exit Long | 23.84 | 3.17% | 9/3/09 |
| EWM_D | 10.04 | Exit Long | 9.62 | 4.18% | 9/2/09 |
| EWS_D | 10.72 | Exit Long | 10.38 | 3.17% | 9/3/09 |
| FMCN_D | 9.62 | Exit Long | 8.85 | 8.00% | 8/17/09 |
| F_D | 7.3 | Exit Long | 7.81 | -6.99% | 8/11/09 |
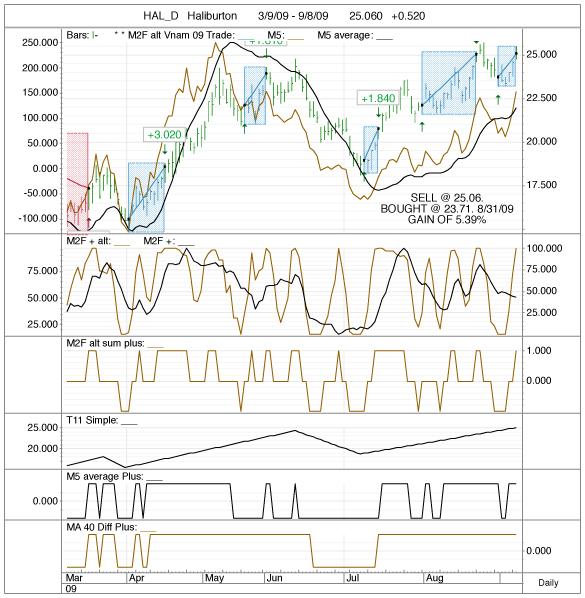
| HAL_D | 25.06 | Exit Long | 23.71 | 5.39% | 8/31/09 |
| MA_D | 207.45 | Exit Long | 200.45 | 3.37% | 9/2/09 |
| VALE_D | 20.93 | Exit Long | 19.21 | 8.22% | 31-Aug |
| FXP_D | 9.28 | Exit Short | 9.98 | 7.01% | 8/11/09 |
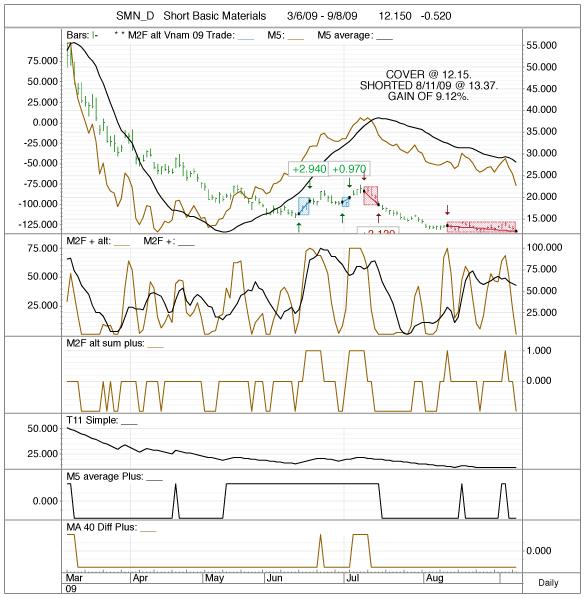
| SMN_D | 12.15 | Exit Short | 13.37 | 9.12% | 8/11/09 |
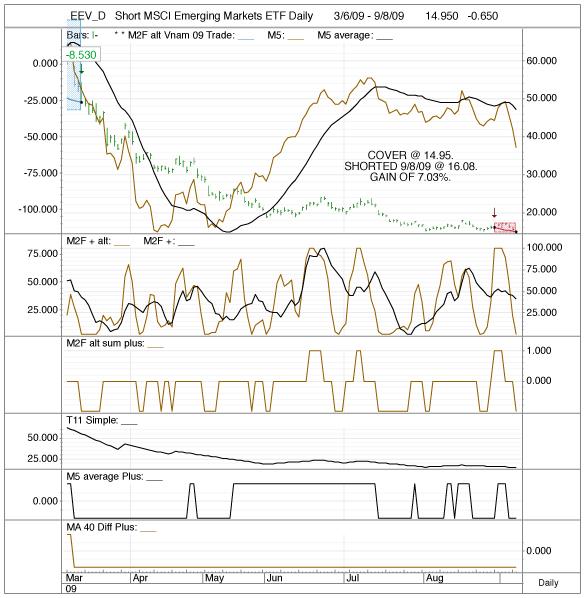
| EEV_D | 14.95 | Exit Short | 16.08 | 7.03% | 9/8/09 |
| EUM_D | 44.87 | Exit Short | 46.4 | 3.30% | 8/28/09 |
| ENTER | price | position | shares | ||
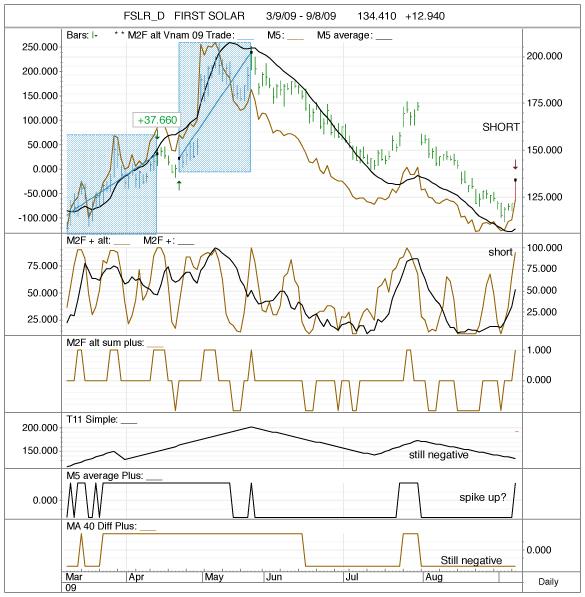
| FSLR_D | 134.41 | Enter Short | -74.39922625 | ||
| M5 10 Trading System | |||||
| EXIT | Close @ | Trade | Open @ | Gain | Date Entered |
| SGINX_D | 15.23 | Exit Long | |||
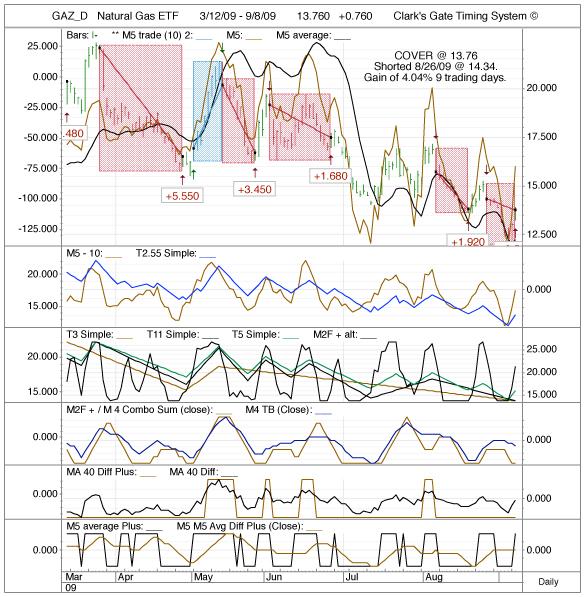
| GAZ_D | 13.76 | Exit Short | 14.34 | 4.04% | 8/26/09 |
| M2F Sum Plus LT 2 Trading System | |||||
| ENTER | price | position | shares | ||
| ^HGX_D | 104.21 | Enter Long | 95.96008061 | ||
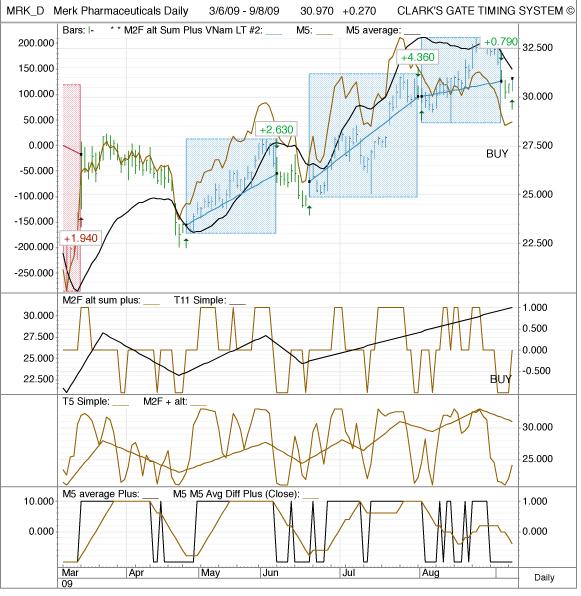
| MRK_D | 30.97 | Enter Long | 322.8931224 | ||
| SCHLX_D | 21.05 | Enter Long | 475.0593824 | ||
| SCPIX_D | 13.53 | Enter Long | 739.0983001 | ||
| M5 Avg Sum Plus Trade | |||||
| ENTER | price | position | shares | ||
| CSUN_D | 4.69 | Enter Long | 2132.196162 | ||
| M4 Sum Plus average REV 09 | |||||
| No trades | |||||
More information on this system can be found at
home.mindspring.com/~mclark7/CGTS09.htm
A draft of the book Turn Out the Lights can be found at the website below. This book is a description of the metaphysical causes of the economic cycles of expansion (Day) and contraction (Night).
www.hoalantrangallery.com/Turnoutlights.htm
MJ Clark's Gate Timing System
Hanoi, Vietnam
84 4 221 92210