
Technical analysis says all the fundamental information of a company resides in its stock chart. The stock chart is a kind of EKG for the company.
I'll buy that, for the sake of argument. As such, how is IBM doing at this moment.
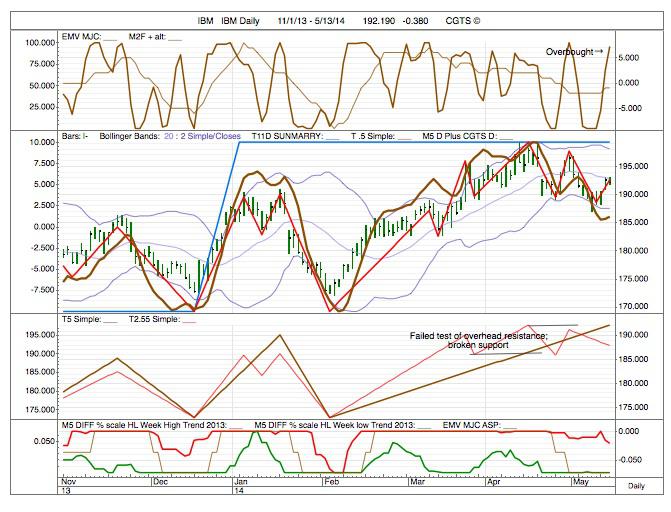
The stock chart is giving mixed signals. The price patterns looks to be making a short-term top. See red line, 2nd pane from the top. Higher highs and higher lows are bullish. Lower highs and lower lows are bearish. IBM is bearish in terms of this indicator.
See also brown line, third pane from the top, for an even shorter-trend breakdown.
Also, short-term momentum is approaching 'overbought'. See brown line, top pane: M2F ALT.
Intermediate-Term Trend (blue line, second pane from the top, T11 Sunmarry) is bullish still. But it is the last to turn down.
The bottom pane shows the 'pulse' of buyers and sellers. The buyers' pulse is in stasis (red line at zero); the sellers' pulse is active (green line below zero).
Shorting a 'fixed market' is always tricky. It is also somewhat arrogant, I admit. The Fed is driving markets higher. Even with so-called tapering. This just means that QE IV is being scaled back. The Fed is still dumping billions into tbonds and housing bonds each month, just at a slower pace than before. The bank bailout is still going full bore. When the Fed begins to liquidate its $4 trillion balance sheet, then QE will be over.
Another reason to be cautious is that the IBM Weekly Chart shows no signs of weakening. Of course, the Daily Chart shows a buckling health much faster than the weekly chart.
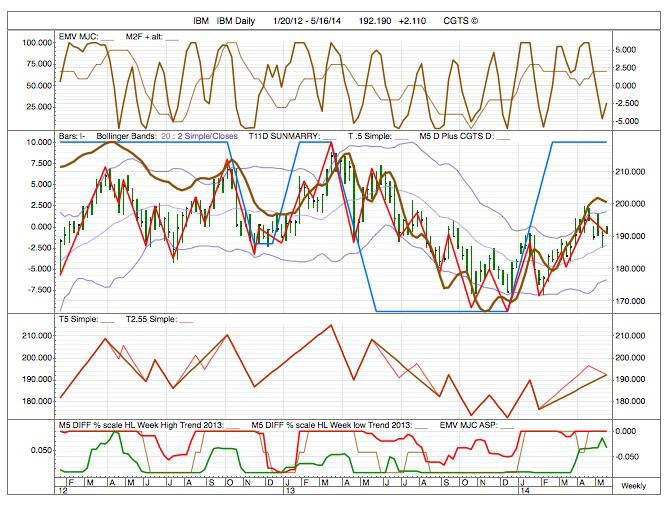
The Weekly Chart is doing almost everything right. Even the Momentum indicator (top pane, brown line, M2F Alt) shows an issue in an oversold state, ready to rally. All the trends are still (and just recently) positive.
So, proceed with caution on any bearish position. The Big Bull is afraid. And the Big Bull fear has been living at a psychotic level for many years now.
We will keep readers up-to-date on the progress of this possible short-sale.
Best trading,
Michael John Clark, CGTS
Hanoi, Vietnam
14 May 2014