TRUMP EARTHQUAKE AFTERSHOCKS NOW LESSENING
Nov 22 9:13 PM•PEIX, UGLD•Comment!
Disclosure: I am/we are long GLD.
I wrote this article myself, and it expresses my own opinions. I am not receiving compensation for it. I have no business relationship with any company whose stock is mentioned in this article.

Japan survives another major earthquake near Fukushima. The tsunami doesn't quite materialize. The aftershocks from the TRUMP EARTHQUAKE (felt keenly in bonds, currencies, and precious metals) has apparently begun to subside.
Last Wednesday night I watched Asian markets sell-off gold and silver. I still hold many gold and silver stocks. I had a sense of dread: another 10% sell off seemed inevitable. I got up early to see the devastation -- to my amazement, gold and silver stocks were not down 10%. They were even. During the day they fought back against sellers, finisheing the day up a bit. Something told me that was the bottom. "Something" -- what is that something? Intuition? A higher sense?
Gold and silver battled higher this week, and seemed destined to trade higher. Are we (LONGS) out of the woods here? Not yet we are not. But at least we are IN the woods -- at least we recognize that much.
We are getting some rumbling in the PM complex.
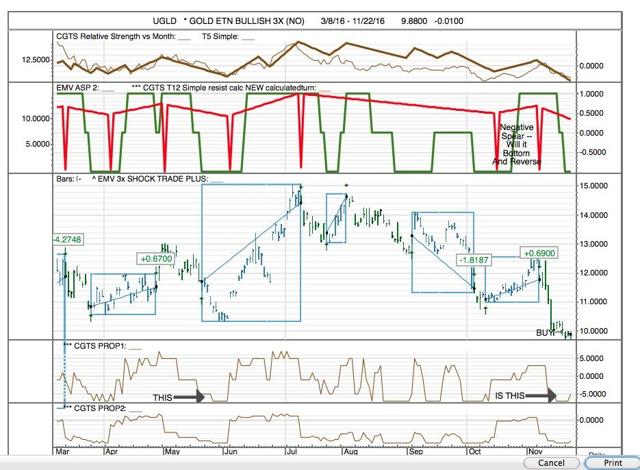
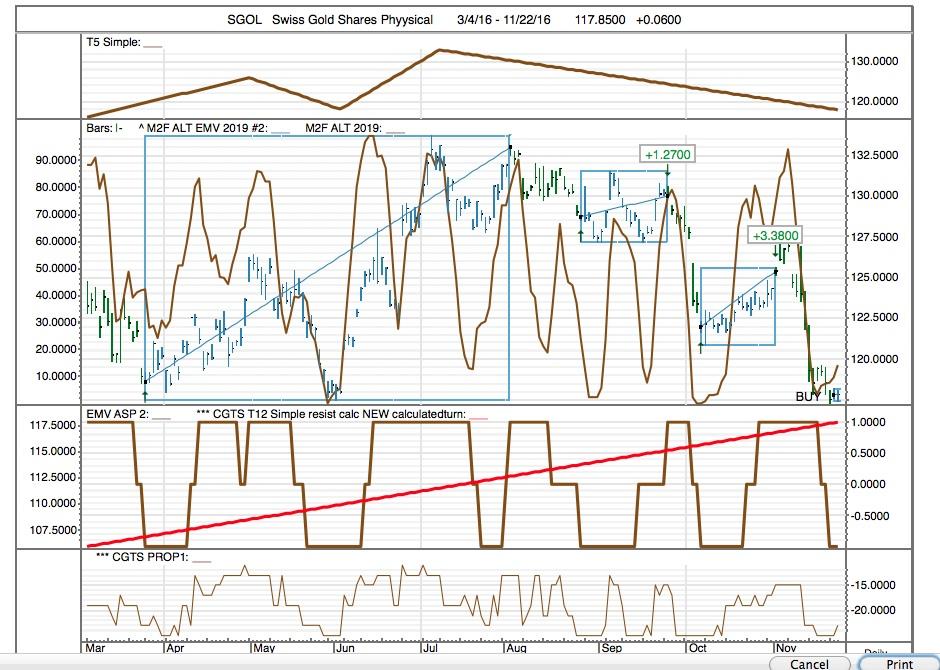
A 3-part trading system we are trading (which ignore PROP) is giving us buy signals on SLV and on SGOL -- see charts below. This system looks for confirmation of EMV, M2F ALT and our Investment Trend, our second longest trend -- and, as I say, it ignores PROP. Why would we ignore Prop? That's a good question. I don't have a good answer. It works with primary momentum.
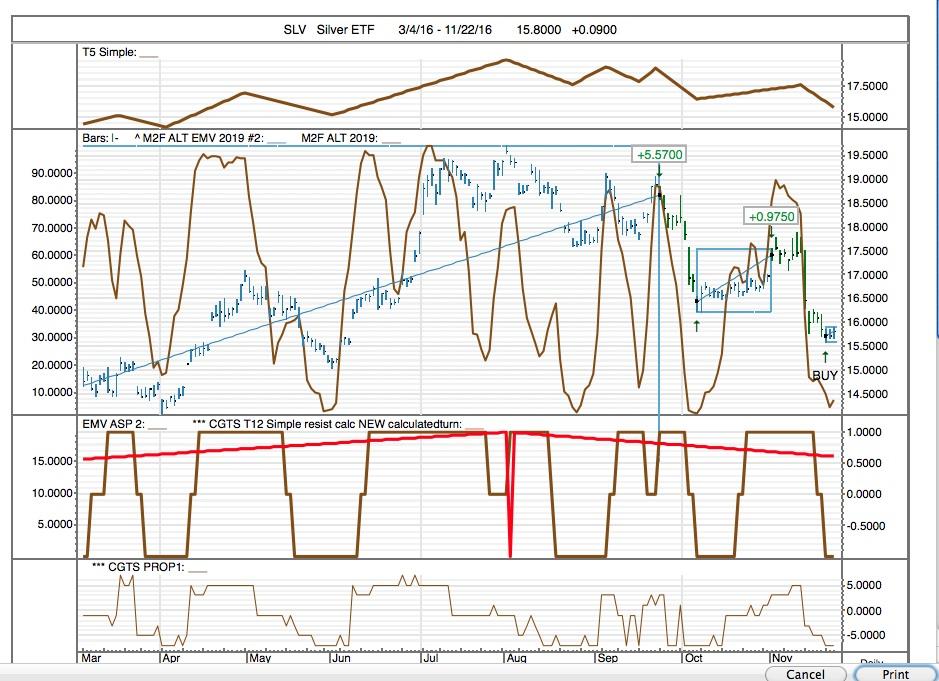
The SLV trend direction (top pane) is not attractive here, however. We'll watch this to see how it does.
We have a Strength Report tonight (OBOS). This is a LOT of data, sorted by WHAT'S HOT on top and WHAT'S NOT on bottom. With each data line we have ST TREND, IT TREND (SPEAR), EMV, PROP2 (TRADING TEMP), PROP1. I use it by looking at the top group for those showing ST TREND and/or TRADING TEMP weakness -- as a potential SELL SIGNAL -- and doing the reverse for the Bottom Group -- looking for SHORT covering or even reversals. Weak stocks with PROP1 strength are clear targets for reversals.
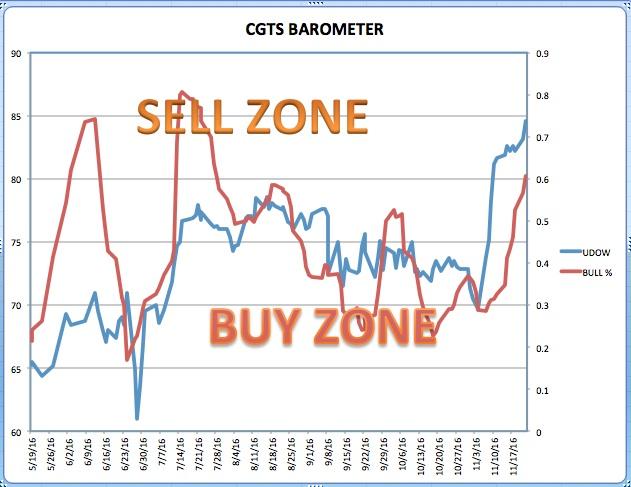
Here's our BAROMETER. We still have room to run up.
Our DASHBOARD shows a recovery in ST TRENDS.
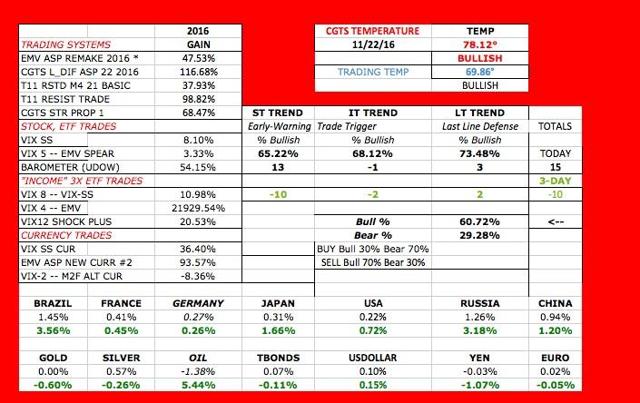
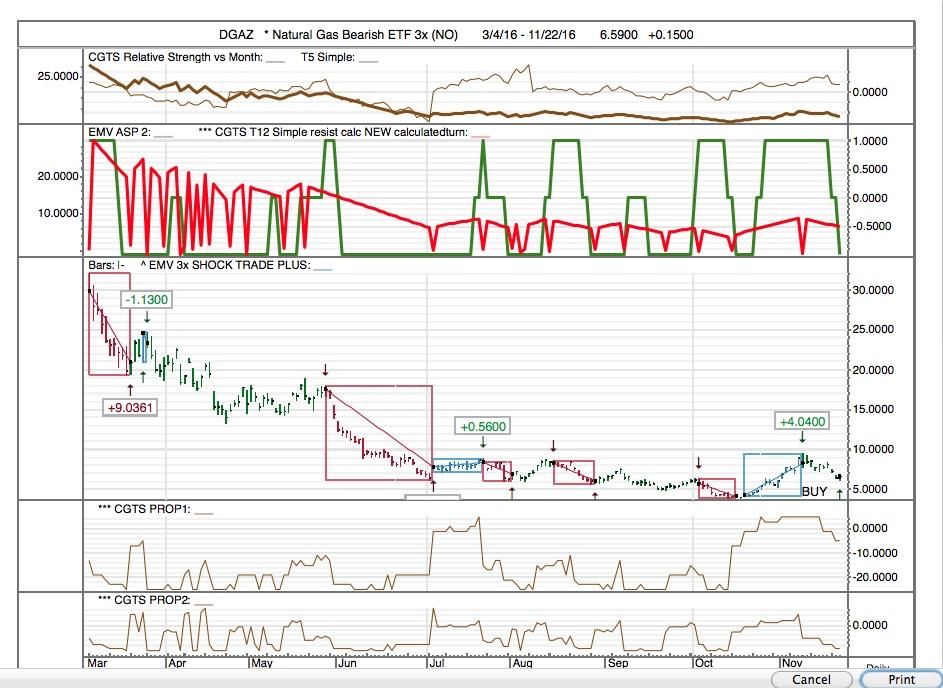
Here is our trading report. Note above, in the DASHBOARD, that our VIX-12 SHOCK TRADE Portfolio has made a dramatic comeback -- up nearly 21%. We are getting three new signals with this trading system: UGLD, LONG; UGAZ, SHORT; DGAZ, LONG. This is saying Gold is going up and Natural Gas is doing down. The UGLD picture is above; here is the DGAZ picture.
11/22/16 | Column1 | Column2 | Column3 | Column4 | Column5 | Column6 |
M2F ALT CURRENCIES | ||||||
NEW POS | NEW POS | |||||
SYMBOL | CLOSE | PROP | POSITION | TODAY | YESTERDAY | ISSUE |
RUBCHF=X | 0.016 | -5 | Short | Enter Short * | Russian Ruble/Swiss Franc | |
EURARS=X | 16.341 | -7 | Flat | Exit Short | Euro/Argentine Peso | |
AUDCNY=X | 5.098 | -5 | Long | Enter Long | Australian Dollar/Chinese Yuan | |
CNYRUB=X | 9.251 | -23 | Long | Enter Long * | Chinese Yuan/Russian Ruble | |
EURCNY=X | 7.317 | -7 | Long | Euro/Chinese Yuan | ||
ICN | 21.29 | 1 | Long | Indian Ruppee ETF | ||
* Not Confirmed by PROP. "TRADING" SYSTEM. | ||||||
VIX-SS CURRENCY | ||||||
NEW POS | NEW POS | |||||
SYMBOL | CLOSE | PROP | POSITION | TODAY | YESTERDAY | ISSUE |
USDRUB=X | 63.715 | -23 | Short | USDollar/Russian Ruble | ||
EURBRL=X | 3.564 | -21 | Short | Euro/Brazilian Real | ||
INRAUD=X | 0.02 | -21 | Short | Enter Short | Indian Rupee/Australian Dollar | |
USDBRL=X | 3.354 | -21 | Short | US Dollar/Brazilian Real | ||
CNYRUB=X | 9.251 | -23 | Flat | Exit Short | Chinese Yuan/Russian Ruble | |
RUBCHF=X | 0.016 | -5 | Flat | Exit Long | Russian Ruble/Swiss Franc | |
EURARS=X | 16.341 | -7 | Long | Enter Long | Euro/Argentine Peso | |
EURCNY=X | 7.317 | -7 | Long | Euro/Chinese Yuan | ||
AUDCAD=X | 0.995 | -5 | Long | Enter Long | Australian Dollar/Canadian Dollar | |
ICN | 21.29 | 1 | Long | Indian Ruppee ETF | ||
EMV CURRENCY | ||||||
NEW POS | NEW POS | |||||
SYMBOL | CLOSE | PROP | POSITION | TODAY | YESTERDAY | ISSUE |
AUDCAD=X | 0.995 | -5 | Flat | Australian Dollar/Canadian Dollar | ||
AUDCNY=X | 5.098 | -5 | Flat | Australian Dollar/Chinese Yuan | ||
AUDUSD=X | 0.74 | -7 | Flat | Australian Dollar/US Dollar | ||
EURCAD=X | 1.429 | -7 | Flat | Euro/Canadian Dollar | ||
FXA | 74.03 | -7 | Flat | Australian Dollar ETF | ||
ICN | 21.29 | 1 | Flat | Indian Ruppee ETF | ||
INRAUD=X | 0.02 | -21 | Flat | Indian Rupee/Australian Dollar | ||
NZDUSD=X | 0.707 | -7 | Flat | New Zealand Dollar/US Dollar | ||
RUBCHF=X | 0.016 | -5 | Long | Russian Ruble/Swiss Franc | ||
VIX 4 | ||||||
NEW POS | NEW POS | |||||
SYMBOL | CLOSE | PROP | POSITION | TODAY | YESTERDAY | ISSUE |
CURE | 27.46 | 3 | Flat | * Healthcare Stocks Bullish ETF 3x | ||
VIX-8 | ||||||
NEW POS | NEW POS | |||||
SYMBOL | CLOSE | PROP | POSITION | TODAY | YESTERDAY | ISSUE |
CURE | 27.46 | 3 | Flat | * Healthcare Stocks Bullish ETF 3x | ||
DSLV | 29.41 | 5 | Flat | * Silver Stocks Bearish ETF 3x (NO) | ||
ERX | 35.9 | 5 | Flat | * Energy Stocks Bullish ETD 3x | ||
IJH | 162.66 | 5 | Flat | Mid-Cap ETF | ||
IJR | 134.28 | 5 | Flat | Small Caps ETF | ||
IWC | 83.57 | 5 | Flat | US Microcaps ETF | ||
QQQ | 118.9 | 5 | Flat | Exit Long | Powershares Nasdaq $ | |
RETL | 44.5 | 5 | Flat | Exit Long | * Retail Stocks Bullish ETF 3x | |
SPY | 220.58 | 5 | Flat | Spider S&P 500 ETF $ | ||
UDOW | 84.6 | 5 | Flat | * UP DOW ETF 3x | ||
UPRO | 77.44 | 5 | Flat | * S&P 500 Ultrapro ETF 3x | ||
VOO | 202.51 | 5 | Flat | S&P 500 (VANGUARD) ETF | ||
VIX-12 Shoch PLUS | ||||||
NEW POS | NEW POS | |||||
SYMBOL | CLOSE | PROP | POSITION | TODAY | YESTERDAY | ISSUE |
DGAZ | 6.59 | -5 | Long | Enter Long | * Natural Gas Bearish ETF 3x (NO) | |
GASL | 44.49 | -15 | Short | Enter Short | * Natural Gas Stocks Bullish ETF 3x | |
UGLD | 9.88 | -5 | Long | Enter Long | * GOLD ETN BULLISH 3X (NO) | |
CGTS STOCKS | ||||||
NEW POS | NEW POS | |||||
SYMBOL | CLOSE | PROP | POSITION | TODAY | YESTERDAY | ISSUE |
^GDAXI | 10,713.85 | 11.00 | Long | Enter Long | DAX German Index Daily | |
ARNA | 1.51 | -3 | Long | Enter Long | Arena Pharmaceuticals | |
HAKK | 40.91 | 7 | Long | Enter Long | * Cybersecurity Bullish ETF 2x (NO) | |
JCP | 9.72 | 5 | Long | Enter Long | JC Penney | |
LL | 18.27 | 5 | Long | Enter Long | Lumber Liquidators | |
LOCO | 12.8 | 5 | Long | Enter Long | El Pollo Loco | |
SDRL | 2.5 | 5 | Long | Enter Long | SeaDrill Ltd. | |
TOO | 5.56 | -1 | Long | Enter Long | Teekay Offsore Partners | |
DWTI | 67.18 | -5 | Flat | Exit Long | * Crude Oil Bearish ETF 3x (NO) | |
RGLD | 70.5 | -1 | Flat | Exit Long | Royal Gold Inc | |
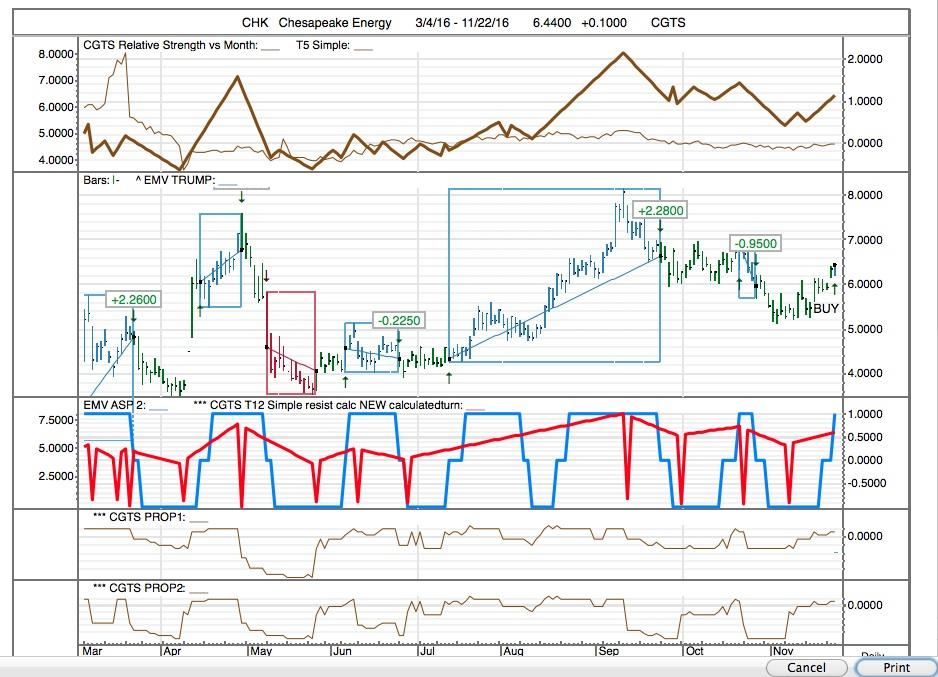
CHK | 6.44 | 3 | Long | Enter Long | Chesapeake Energy | |
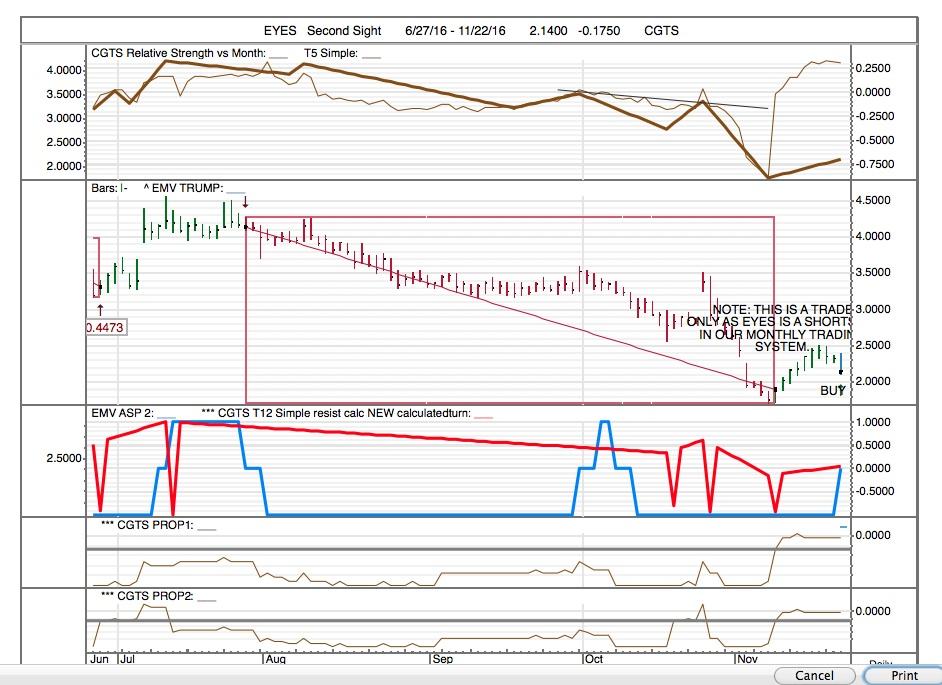
EYES | 2.14 | -1 | Long | Enter Long | Second Sight | |
PEIX | 7.75 | 3 | Long | Enter Long | PACIFIC ETHANOL | |
HL | 6.26 | -7 | Flat | Exit Long | Hecla Mining | |
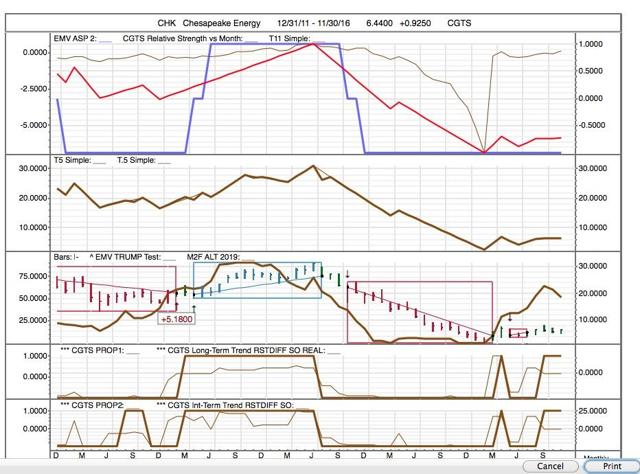
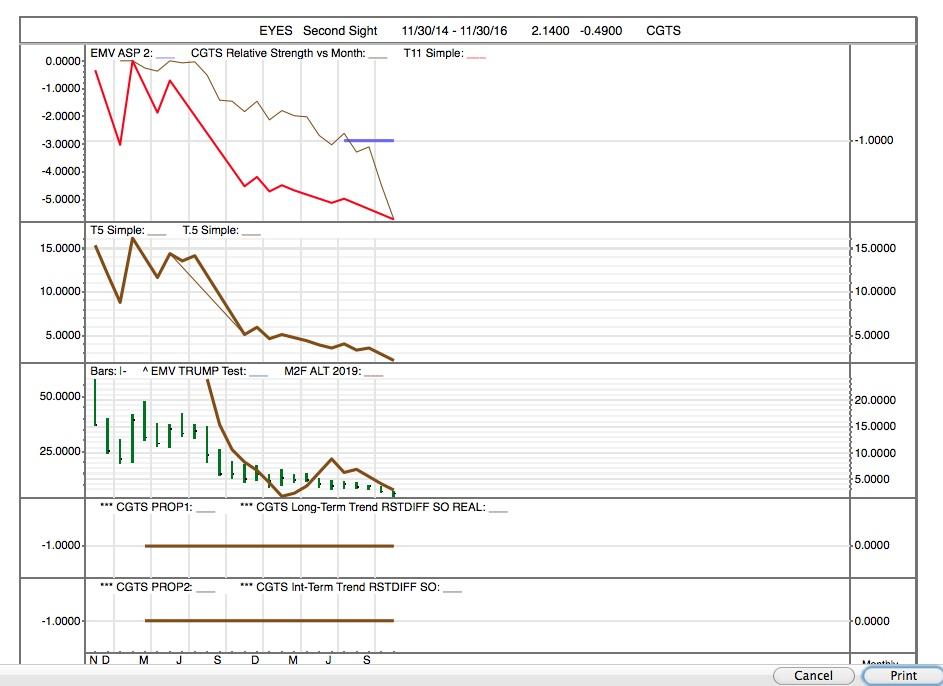
Of tonight's stock trades, we like PEIX more than the others. Notice how new LONG trades are drying up. This is what one would expect as a rally matures. It is nice that we are NOT getting a raft of SELL or SHORTSELL SIGNALS. We like PEIX because we like PEIX in the monthly charts. We hate EYES in the montly charts -- it is a shortsale. Note, however, a turnaround we show its new colors in the Daily Charts before it will in the monthly. CHK is more likeable than EYES; but its monthly chart is still neutral.
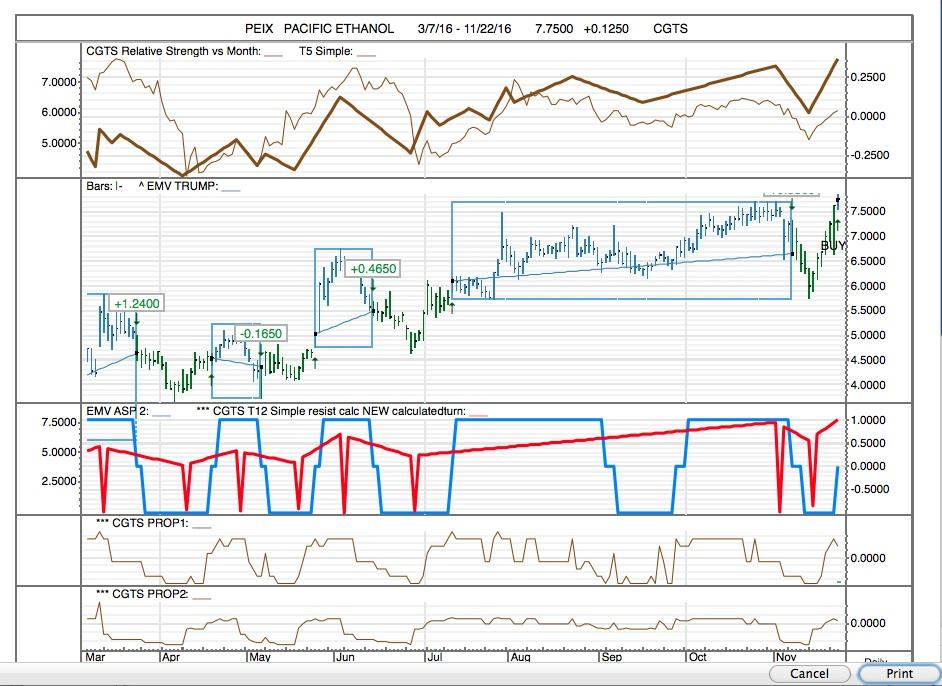
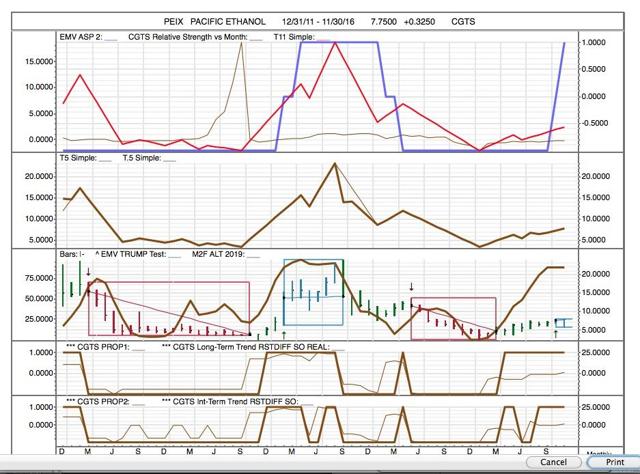
Here's the second-best monthly, the daily first:
We do like EYES as a daily chart, although its trend direction (top pane) is a warning:
We hate the monthly chart:
Best to all.
MJC, CGTS