The best sites for closed end funds are CEF Connect and one operated by the Closed-End Fund Association.
For those unfamiliar with CEFs, I have linked the following material for review:
Understanding the Advantages of Closed-End Funds.pdf
Closed-End Funds: 7 Reasons to Invest
CEF - Closed End Funds | Morningstar (subscription publication, some content is free)
My last CEF update was published in April: Update For Closed End Fund Portfolio As Of 4/8/15 - South Gent | Seeking Alpha
In that update and others, I provided links to other posts discussing trades that contained snapshots of realized gains or losses. The April 2015 post linked posts showing a $4,073.7 net realized gain since November 2014. Closed End Fund Portfolio: November 2014 Update - South Gent | Seeking Alpha
Closed End Portfolio as of 7/28/15:
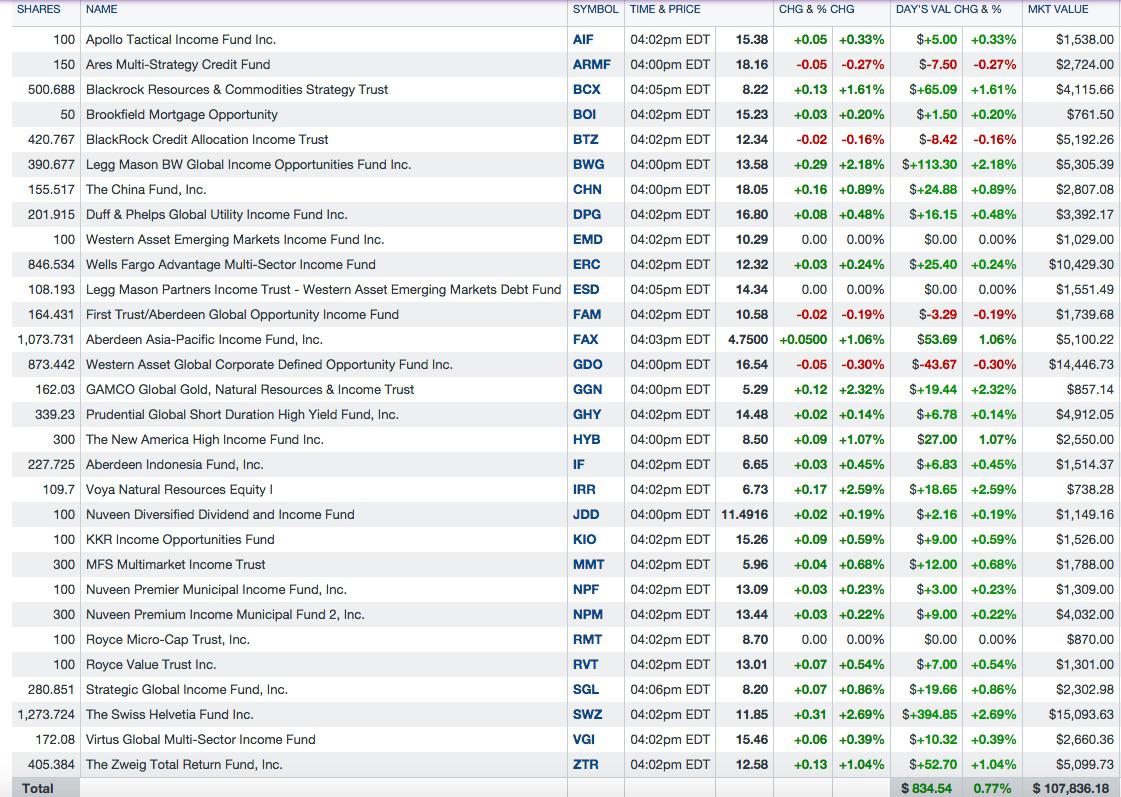
I include reinvested dividends in this table but have not included those received today. I will also receive shares bought with dividends over the remainder of this week. The largest share purchase with a dividend will be the Swiss Helvetia fund on 7/31 given the size of the position and a $.272 per share payment. The Swiss Helvetia Fund, Inc. Declares Income And Capital Gains Distributions The other payments are regular monthly dividends (e.g. GDO, ERC, BTZ, GHY, SGL, NPM, NPF, etc.)
The CEF basket is my largest one and will generally range in the $100K to $250K range. I am at my bottom monetary exposure level now after significant selling over the past 2 years.
I now have the capacity to start buying and will probably focus more on leveraged bond CEFs than stock CEFs over the next month or so.
Over the past several months, the market prices of leveraged bond CEFs have gone down significantly in price, driving up the yield and increasing the discounts to net asset value way above historical norms. The market price declines have far exceeded the decline in net asset values associated in large part to interest rates rising earlier this year and to the strength of the U.S. Dollar for funds owning foreign bonds.
It looks like mass panic selling by individuals who dominate trading in those securities. The herd will continue in whatever direction it is moving until enough investors ask themselves a simple question, "why exactly am I selling". There are issues, of course, that caused me to lighten up including the tick up in intermediate and long term rates and the increases in short term borrowing costs starting likely starting later this year when the Federal Reserve starts to raise the federal funds rate from zero.
Closing Discounts Today Compared to Average 3 Year Discounts Per Morningstar, As of 7/28/15, For Bond CEFs:
Aberdeen Asia-Pacific Income Fund (FAX) -16.67%/-7.02% BlackRock Credit Allocation Income Trust (BTZ) -15.6%/-11.46% Legg Mason Global Income Opportunities Fund (BWG) 16.28%/-10.96% MFS Multimarket Income Trust (MMT) -14.12% (discussed below)/-9.81% New America High Income Fund (HYB) -15.98% as of last Friday (discussed below)/-7.2% Nuveen Premium Income Municipal Fund 2 (NPM) -12.68% (discussed below)/ -8.51% Western Asset Global Corp Defined Opportunity Fund (GDO) -14.17%/ -8.29% Wells Fargo Advantage Multi-Sector Income Fund (ERC) -15.9%/ -9.96%Since the charts for these funds and many others reveal falling knives, that will not dissuade me from buying but will cause me to buy in small lots and to space purchases out over time. I will reinvest the dividend for several of these ETFs when the discounts are this large. Sometimes, I will own a position in two accounts and will reinvest in one and take the cash in another. When I take the cash, I am more likely to aggregate the dividend payments and to buy a small lot when the price has fallen significantly.
Any bond fund that owns junk rated credits needs to be checked for E & P company exposure. Many of those bonds are gone back into the crapper again. I have provided links to shareholder reports for those type of funds discussed in this post. I will not be discussing that exposure here.
I view the closed end portfolio to be a balanced worldwide portfolio within a larger portfolio that includes individual stock and bond selections.
I place an emphasis on income generation and own a number of CEFs that pay monthly dividends.
I will change the weightings in the CEF portfolio based on my opinions about the balance between risks and rewards.
Generally, realized gains from bond funds will be substantially lower than for stock or balanced funds. I am simply trying to harvest dividends in bond CEFs and to hopefully escape with small profits on the shares.
I will not be discussing deletions/reductions in detail.
I view the deletions/reductions to be as important as the additions.
Deletions/Reductions Since Last Update:
Adams Diversified Equity (ADX)(formerly known as Adams Express)-Eliminated (+$1,983.24)
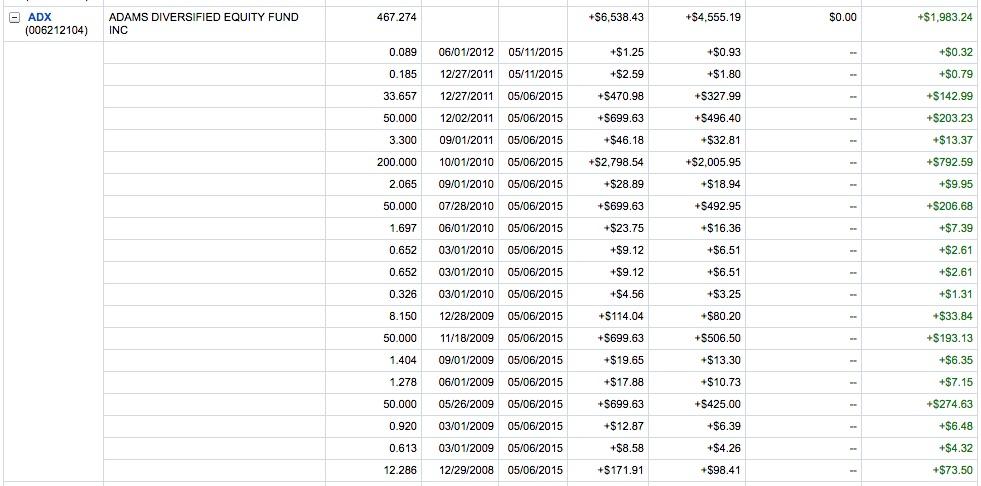
Rationale: Profit Taking; Harvesting Dividends Used to Purchase Shares at a Profit; Concerns About Market's Valuation; Capital Preservation Focus
Sponsor's Website: Adams Express Company
Quarterly Changes in Portfolio Securities
Morningstar Page: ADX (rated 4 stars as of 7/31/15)
Links to Prior Reductions: Item # 4 Sold 116 ADX at $13.61 (6/14/14 Post)(profit snapshot=$319.38); Item # 4 Pared ADX Again-Sold 143 Shares at $13.97 (8/9/14 Post)(profit snapshot=$427.9)
Link to Last Shareholder Report: ADAMS DIVERSIFIED EQUITY FUND, INC.-JUNE 30, 2015 (SEC Filing)
Historical Dividends: Adams Diversified Equity Fund Dividend History
Adams Express became a closed end fund shortly before the 1929 stock market crash. I started to buy shares in 1984 and have periodically bought and sold shares since that time.
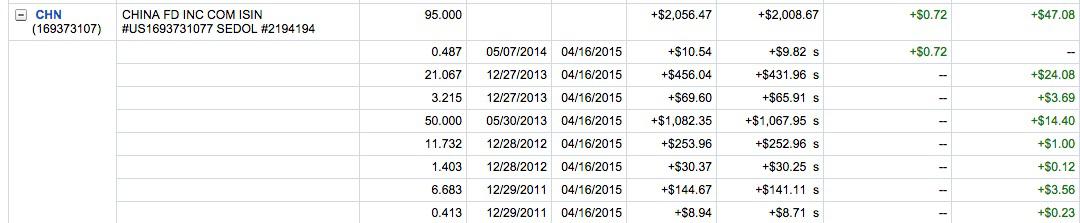
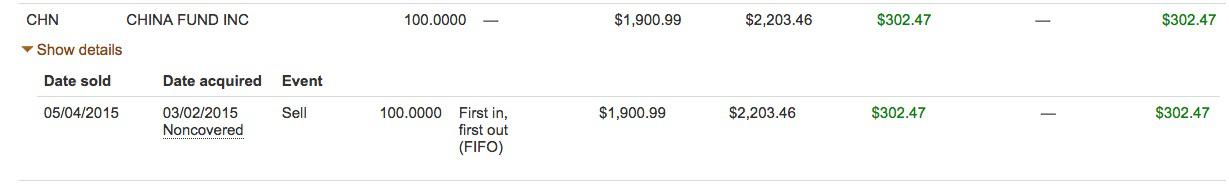
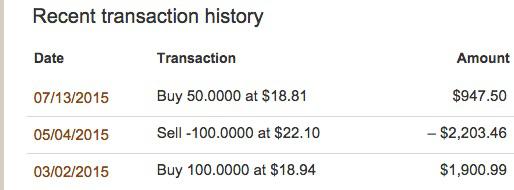
China Fund (CHN)-Reduced Then Bought Back 50 Shares (+$47.8 and +$302.47)
I have sold the shares discussed in this Instablog:
Added To China Fund (CHN) at $18.94- South Gent | Seeking Alpha
I still own these shares in a taxable account:
Added To China Fund (CHN) at $17.79- South Gent | Seeking AlphaI bought 50 shares back after China's stock market melted down, but before the meltdown earlier this week. (discussed below).
Rationale: Harvesting Dividends for a Profit; Concerns about China's stock market; Capital Preservation Focus; and I Always Sell Into Parabolas.
I also liquidated a mutual fund that invests in China's stock market before the first meltdown became serious.
Sponsor's Webpage:
Morningstar Page: CHN (rated 4 stars)
Link to Last Shareholder Report: China Fund (SEC Filed)
Historical Dividends:
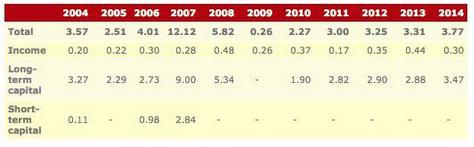
This fund makes annual dividend payments mostly sourced from long term capital gains, though there was a large short term capital distribution in 2007.
The income dividends are fairly consistent in the $.2 to $.48 per share range.
Given the size of the distributions, it is difficult to harvest any gain on the shares. China's stock market went into a parabolic spike last year and into 2015 that allowed me to harvest some modest share profits including shares purchased with reinvested dividends.
Shanghai Index Interactive Stock Chart
Total Dividends 2011-2014=$13.33 per share
Western Asset Inflation Limited Opportunities (WIW)-Eliminated
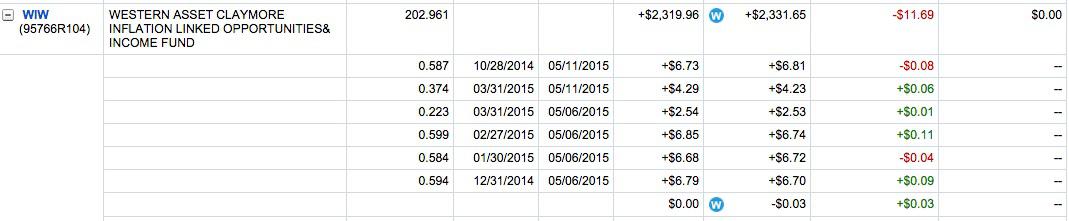
Rationale: Trading Vehicle-Looked Like the Price Was About to Decline-Took Small Loss; Low Dividend Yield-Not Paid to Wait; Potential Mispricing of Inflation Risk
Sponsor's Website: WIW
Morningstar Page: WIW (unrated)
Link to Last Shareholder Report:
WESTERN ASSET/CLAYMORE INFLATION-LINKED OPPORTUNITIES INCOME FUND (WIW)(SEC Filing)Historical Dividends: WIW Dividend History
Links to Prior Trades: I have harvesting dividends and traded this CEF frequently over the years. I linked recent prior trades in these two posts that have snapshots, showing $656.15 in net profits excluding dividends. Item # Sold 301+ WIW at $11.72 (11/6/13)- Item # 6 Bought 300 WIW at $11.44 (7/31/13)
I have traded another CEF, now liquidated by the sponsor, for a similar gain (formerly traded under the IMF symbol-snapshots at Sold 200 of the CEF IMF at $17.98-Roth IRA)
I have sold out of the ETF TIP.
My last TIP bonds were sold at a NEGATIVE .89% yield to the purchaser. Item 1 Sold 3 TIP Bonds Maturing in 2019 at $120.45 (snapshot of realized gain=$838.87). Just nutty!
I discuss several issues relating to treasury inflation protected securities in two old posts:
Advantages and Disadvantages of Treasury Inflation Protected Securities:
Treasury Inflation Protected Securities as a Non-Correlated Asset
The following charts contain relevant data points on the ten year TIP:
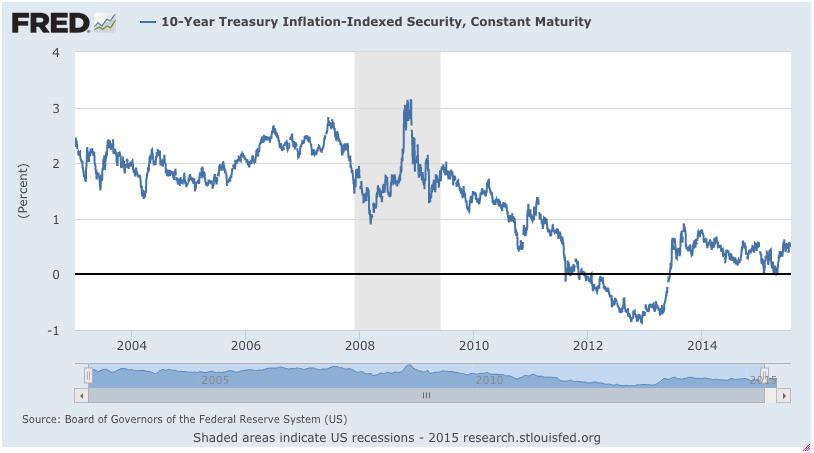
10-Year Treasury Inflation-Indexed Security, Constant Maturity

10-Year Breakeven Inflation Rate-St. Louis Fed
When I took those snapshots, the current yield was .49% and the break-even spread was at 1.79%.
The break-even spread is the annual average CPI rate necessary for the TIP buyer to break-even with the buyer of the ten year non-inflation protected treasury.
If the average annual rate turns out to be 3%, the TIP would be a better buy even with the .49% starting point. The non-inflation protected security would be better with the average annual CPI rate at less than the break-even. In the later case, there is no way for the TIP to catch up to the non-inflation protected note given the starting yield differential.
However, the market may be significantly mispricing both the nominal and real yields due to a variety of factors including massive central bank intervention in the treasury market driving both down to artificial levels.
The break-even spread is an easy computation to make. Simply subtract the real current yield from the nominal yield.
2015 Daily Treasury Nominal Yield
2015 Daily Treasury Real Yield Rates
10 Year 7/24/15
Nominal: 2.27%
Real: .51%
Difference: 1.76% = Break-Even
WIW is back on my radar screen but it is hard to become excited about the current yield which is also the case for ACG discussed below.
AllianceBernstein Income Fund (ACG)-Eliminated
Rationale: Response to Rising Rates When Sold; Capital Preservation Focus and Total Return Considerations for Roth IRA
Sponsor's Webpage: AllianceBernstein Income Fund
CEFConnect Page for ACG
Total ACG Trading Profits: $495.02 (links to posts with snapshots in the "Prior Trades" section of Generating Tax Free Income In The Roth IRA: Bought Back ACG - South Gent | Seeking Alpha)
Blackrock Core Bond Trust (BHK)-Eliminated
Pared Interest Rate Risk Exposure In Roth IRA: Sold 300 ACG At $7.81 And 200 BHK At $13.86 - South Gent | Seeking Alpha (4/30/15 Post; Total Realized Gains for BHK and ACG=$176.65)
It has been extremely difficult since early 2013 to harvest share gains in leveraged bond CEFs.
Rationale: Response to Rising Rates When Sold; Capital Preservation Focus and Total Return Considerations for Roth IRA
Sponsor's webpage: CORE BOND TRUST | BHK
CEFConnect Page for BHK
Prior Elimination: Item # 2 Sold All of the Bond CEF BHK at $14.058 (2/21/12 Post)
This one is back on my radar screen. I have no current position.
Swiss Helvetia Fund-Eliminated Roth IRA Position and Increased Taxable Account Position (discussed below)
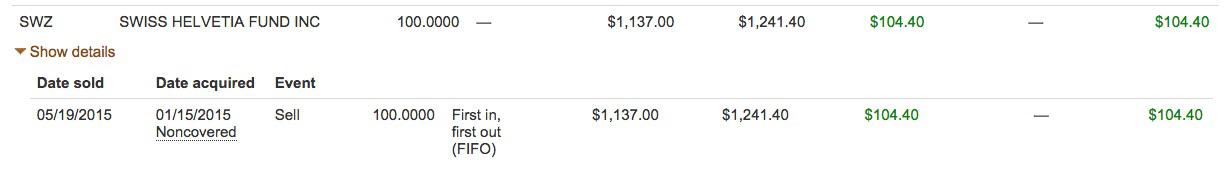
Rationale: Preservation of Capital Dominance in Roth IRA Management; Profit Taking
I sold the shares discussed in this post:
Going Slightly Deeper Into Swiss Franc Priced Assets: Added To The CEF Swiss Helvetia Fund (SWZ) - South Gent | Seeking AlphaFirst Trust Intermediate Duration Preferred and Income Fund (FPF)-Eliminated Remaining Shares

Rationale: Response to Rising Rates, Harvesting Profits in Shares Bought with Dividends; Total Return Considerations When Rates are Rising
Sponsor's Webpage:
First Trust Intermediate Duration Preferred & Income Fund (FPF)FPF Page at Morningstar (not rated)
Last SEC Filed Shareholder Report: Period Ending 4/30/15
Last Discussed: Item # 3 Added 50 FPF at $21.53-Roth IRA (11/17/14 Post) and Item # 2 Sold Highest Cost 150 FBF at $22.42 Roth IRA (1/14/15 Post)
Eaton Vance Tax-Managed Global Fund (EXG)-Eliminated

Rationale: Capital Preservation Focus in Roth IRA; Narrowing Discount to Net Asset Value Per Share; Poor Performance Since Inception-Better Over the Past 3 and 5 Years; Huge ROC Support for Dividends ($132.938M for the six months ending 4/30/15, Sourced From Page 16)
Sponsor's Website: Eaton Vance
EXG Page at Morningstar (3 stars as of 7/31/15)
Last SEC Filed Shareholder Report: Eaton Vance Tax-Managed Global Diversified Equity Income Fund
When I mention "narrowing discount", I am referring to a lower discount to net asset value per share than when I purchased shares and/or a lower discount to historical averages.
A SA author published a recent article: EXG My total return was fine with dividends reinvested.
Virtus Global Multi-Sector Fund (VGI)-Reduction
I sold a 100 share lot at a small profit:

The total return without monthly dividends reinvested was 7.06% using this Calculator If had not sold, the total return would have been close to zero. I bought this lot as a trade. Item # 4 Bought 100 VGI at $16.65 as a Trade
Rationale: Capital Preservation When Interest Rates are Rising; Foreign Bond Risk When the USD is Rising
USD priced foreign bond CEFs have been crushed since the USD started to gain against other developed nation currencies and emerging market currencies. The parabolic rise in the USD can be seen in five year charts for the Dollar Index and the Bloomberg Dollar Spot Index which has more foreign currencies and different weightings than the DXY:
U.S. Dollar Index (DXY) Interactive Index ChartThe recent spurt up in intermediate and longer term rates added to the pain. Several leveraged foreign bond fund CEFs are now selling at greater than 10% yields and 15% discounts to net asset value.
Sponsor's Website: Virtus Investment
CEFConnect Page for VGI
VGI Page at Morningstar
Last SEC Report: Virtus Global Multi-Sector Income Fund
Total Net Realized Gain Since Last Update: +$2,604.98
Gains from the shares, as distinguished from harvesting a total return, are becoming hard to find, particularly in bond CEFs. Given the high dividend yields based on TTM data, I would be satisfied with a total return equal to the dividends.
Nuveen Diversified Dividend Income Fund (JDD) -Eliminated (see snapshots in Appendix)
Rationale: Part of a Widespread Reduction in Interest Rate Risk Securities in Response to Rising Rates.
I bought 100 of the 200 shares sold back this week at $11.45. I briefly discuss this purchase below:
+++++++++++++++++++++++++++++++++++++
Purchases Since the Last Update:
I will only discuss a selection here, since it takes time to discuss each one. I will probably discuss in my next update several additions to leveraged bond CEFs now selling at over 15% discounts to their respective net asset values.
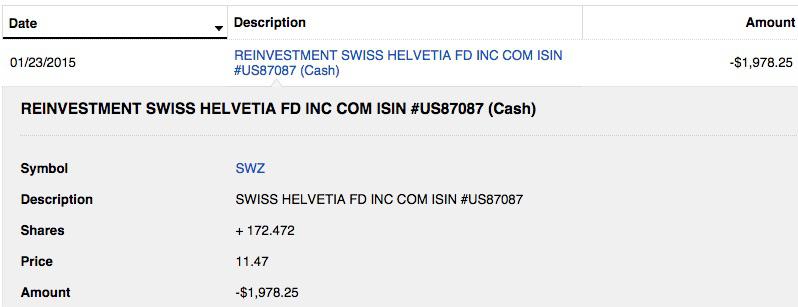
Swiss Helvetia Fund: I bought 200 shares after selling the 100 shares held in the Roth. I have been building up a position since 2008 in my main taxable account. I received a significant dividend distribution last January that was used to purchase 172.472 shares:
Sponsor's Webpage: Swiss Helvetia Fund
CEFConnect Page for SWZ
Last Shareholder Report: THE SWISS HELVETIA FUND (period ending 3/31/15; unrealized gain $127.534+M-no loss carryforwards)
Dividend History 2009-2014: Dividends are generally paid semi-annually and are sourced largely from long term capital gains.
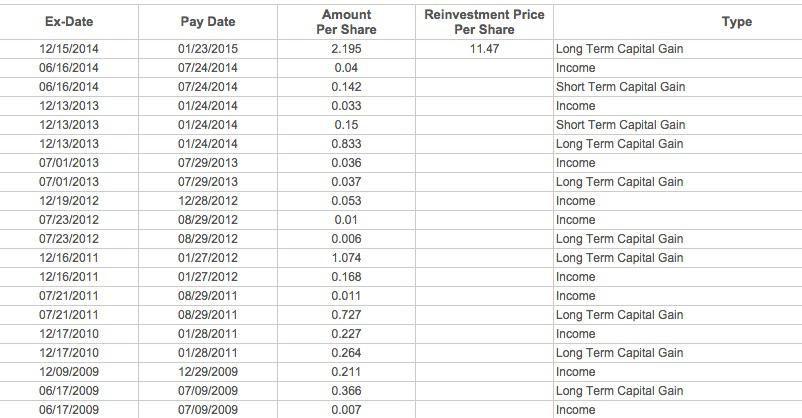
Sourced: Swiss Helvetia Fund
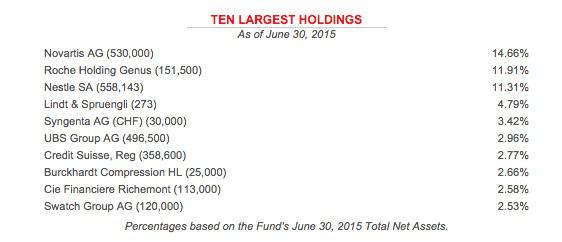
I pick up a broad exposure to several Swiss blue chips, including Novartis, Roche and Nestle.
The fund also owns several biotechnology companies that are interesting to me, a non-expert in that area.
Lindt & Spruengli is interesting since it has been expanding its distribution in the U.S. I can now buy their chocolate balls at the local supermarket. I am not adverse to consuming this product. SWZ owns 273 shares that were worth $17.285+M as of 3/31/15, purchased at a $6.9+M cost.
Needless to say, I am not in the market to buy a share which is now trading over 62,000 Swiss Francs: LISN:SIX Swiss Ex Stock Quote - Chocoladefabriken Lindt & Sprungli AG
I do own Novartis and Nestle, buying the ADRs traded in the U.S. that are priced in USDs.
I last discussed those positions here:
Added To Nestle (NSRGY) At $68.8 - South Gent | Seeking Alpha; Dividend Growth Strategy: Novartis - South Gent | Seeking Alpha. The last material discussion for NVS was in a December 2013 which has snapshots of trades and existing positions: Item # 1 Bought: 50 NVS at $76.72One of the top ten positions, Syngenta AG (SYT), is being pursued by Monsanto. WSJ; Bloomberg Business; Reuters
The two large Swiss financial institutions, UBS and Credit Suisse, have share price recovery potential:
One problem with SWZ is that the stocks are priced in Swiss Francs which has been falling in value against the USD. This fund is priced in USDs. The recent decline in the CHF flows through into the net asset value of SWZ. The converse is also true. A rise in the CHF/USD will flow through into net asset value. USD/CHF Chart
The Swiss National Bank has been successfully so far driving down the CHF's value through abnormal monetary policies including negative deposit rates, currently around -.75%.
Swiss National Bank (SNB) - Current interest rates and exchange ratesThe problem for the SNB is the weak Euro now rather than the strong USD. But those monetary policies will drive the CHF down against the USD too.
Discount as of 7/28/15= -15.08%
China Fund: I elected to buy back 50 of the 195 shares sold, mentioned above, after the collapse in China's stock market. China's stock market is riskier than most at the current time.
Roth IRA Account:
Sponsor's Website: The China Fund, Inc. - Home
CHN Page at Morningstar (4 stars)
Last Shareholder Report: China Fund (net realized gains for the six months ending 4/30/15=$13.634+M; 90.23+M)
Link to Manager's Last Update: The China Fund
Basic Data:
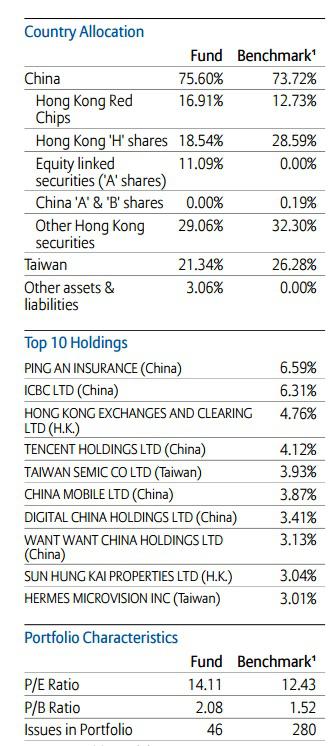
Rationale and Risks:
1. Dividends: This fund has been a MONSTER dividend machine since I initiated a position back in 2011.
As noted above, the fund has paid out $13.33 per share in dividends between 2011-2014.
It is also easily the most tax inefficient fund that I own given those large distributions. I first bought shares prior to the 2011 distribution and have continuously owned shares since then, though the number of shares owned has varied as I attempt to liquidate the highest cost shares profitably, a very difficult task given the size of these distributions:
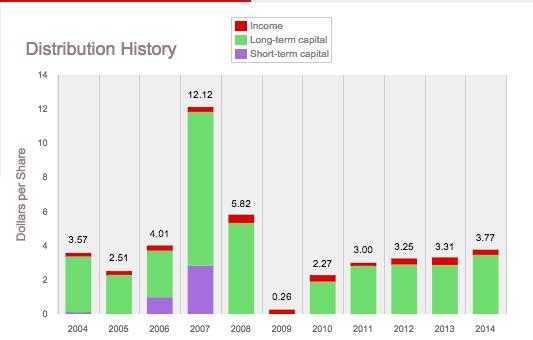
Sourced: The China Fund, Inc. - Distribution history
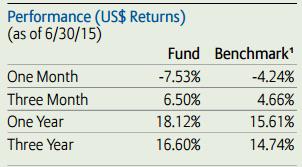
2. Total Return Potential: Based on past results, and the past may not be prologue, this fund has generated decent total returns as shown in the Morningstar data for 10 and 15 years: Total Returns The results are far less impressive over a 5 year period, but that is really due to the recent swoon and the overall performances of the stock indexes compared to the U.S. S & P 500.
SSE Composite Interactive Chart (Shanghai)
Hang Sang Index Interactive Chart (Hong Kong)
TSEC Index Interactive Chart (Taiwan)
3. Risks: Investors familiar with the recent gyrations in China's stock market and the government's response to the recent decline do not need an exploitation about risks. Business Insider; "Cramer: China has peaked"; China's Debt-to-GDP Ratio
For a variety of reasons, the China Fund will be less risky than an ETF that owns China A shares like the
Deutsche X-trackers Harvest CSI 300 ETF (ASHR) that rose 51.1% last year and is down -14.45% YTD through 7/24. The China Fund owns stocks based in Hong Kong, China and Taiwan and is generally focused on more seasoned companies whose P/Es are rational assuming the accounting is close to being accurate.4. Beating Benchmark:
The benchmark is the MSCI Golden Dragon Index.
Royce Value Trust (RVT): I eliminated my position in 2013 and have started to buy back shares. I have no idea when or even if I will buy more shares, or the number of shares. Item # 1 Sold 505+ RVT at $15.89 (8/3/13 Post)(snapshot of profit=+$436.03)
Sponsor's Website:
Royce Value Trust (RVT)CEFConnect Page for RVT
Last Shareholder Report: Q/E 3/31/15 Holdings (unrealized gains=$212.62+M); 2014 Annual Report
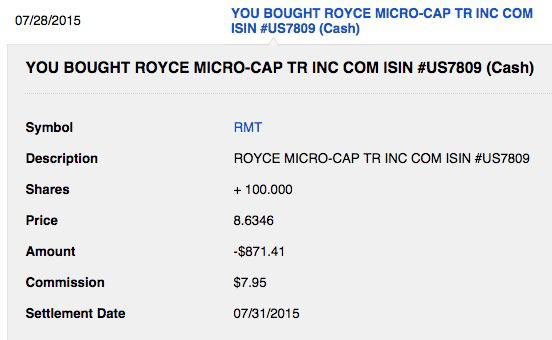
Royce Micro Cap Trust (RMT): This CEF was eliminated in 2014, and I have just started to nibble with a 100 share purchase.
RMT at $8.63:
Item # 2 Sold 433+ RMT at $12.76-Average Cost Per Share $7.91 (snapshot of profit=+$2,057.88 including profits for all shares bought with reinvested dividends)
Earlier in 2014, I sold 126 RMT shares bought with dividends and realized a $149.91 profit on those shares. Item # 6 Sold Taxable Account: 126 RMT at $12.6 (7/12/14 Post)
I will frequently harvest profits in shares bought with dividends in order to improve the dividend yield of those distributions. Many investors may prefer to leave matters alone.
Snapshots of recent RMT trading history can be found in the Appendix below.
Rationale RMT 2014 Elimination:
One reason for selling those shares was that RMT had declared a large year end capital gain distribution. I do not view those events favorably. I am worse off after receiving one when the position is held in a taxable account, even when the dividend is primarily sourced from long term capital gains. The distribution reduces net asset value by an amount equal to the distribution, causing a downward spike in the share price, and I am left with a tax liability. The shares purchased with a large distribution would then have to produce after tax income and/or realized gains from their disposition equal to the tax paid just to break even.
If the market turns down and the shares bought with the reinvested dividend lose value, then the value of the dividend is diminished, reducing my dividend yield compared to receiving the distribution in cash.
Rationale and Risks for RVT and RMT:
1. Good Managers:
The Royce managers are good and specialize in small cap stocks with a value tilt.
As a value/contrarian investor, I am naturally attracted to their investment style.
It is certainly more difficult now to find small caps using a value orientation.
I would criticize their selection of small bank stocks and their underweighting in that sector since 2009. I would give the managers a "C" in their stock selections sector. Royce Micro Cap had a 2% weighting in banks as of 3/31/15 owning Chemung Financial (CHMG), Facquier Bankshares (FBSS), Peapack (okay IMO), Blue Hills and a few others.
I have bought and sold FBSS as part of my regional bank basket and have no interest in it now. For small Virginia banks which may be acquired due to their geographic location, I would put at least three ahead of FBSS on financial metrics and overall desirability.
RVT also had a 2% weighting in banks as of 3/31/15, owning some of the same bank including FBSS and Blue Hills. RVT added names like First Citizens BankShares Class A and Farmer's and Merchants Bank of Long Beach (OTCQX:FMBL). The two later stocks have done well recently but are high priced and thinly traded.
While FCNCA is on my regional bank monitor list, I am unlikely to buy given the <.5 dividend yield and average financial numbers such as ROA at .85%, ROE at 9.5%, NIM at 3.18%, pedestrian capital ratios, all as of 3/31/15 First Citizens BancShares Reports Earnings for First Quarter 2015)
2. Good Total Returns During Bull Markets/Generally Worse than the S & P 500 During Meltdowns/Bear Markets:
I have observed that the elevator goes down faster than it goes up.
RMT generated stellar returns in the 2009-2014 period. When I sold my last lot, RMT had generated a total annualized return of 32.06% between 3/9/2009 through 12/5/14: Calculator
Trees do not grow to the sky.
The annualized total return since 12/5/14 through 7/25/15 was -17.39%.
Both CEFs support their distributions with capital gain distributions.
The Near Depression resulted in stock funds going from an unrealized gain position to an unrealized loss position, both on a total portfolio basis and for most individually owned stocks. There were no capital gains to be harvested to support the dividend.
When that happens, and it will from time to time, the fund then has to decide whether to support a dividend with ROC.
The Royce CEFs basically eliminated their distributions for a period rather than to use ROC, and I supported that decision. I see no clear benefit from receiving my capital back disguised as a dividend.
Other individual investors will sell when there is a dividend cut and that is when I was buying. Both RMT and RVT later returned to sizeable unrealized gains and started to harvest gains to support their generous payouts after readopting a managed distribution plan.
RMT Dividend History (no dividend paid between 9/2008 and 12/2010)
Royce Value Trust (RVT) Dividend History (same period with no dividends)I recently bought 100 RVT at $13.35 (7/20/15). Unlike prior purchases, I placed this lot in a Roth IRA rather than a taxable account.
Morningstar Data-Total Return Calculations:
Royce Value Trust (RVT) Total Returns (e.g. down 48.52% in 2008 vs. -36.81% for the ETF SPY; and up 35.76% in 2009; 35.05% in 2010, 16.33% in 2012 and 36.35% in 2013 vs. SPY at 26.37% in 2009, 15.06% in 2010, 15.99% in 2012 and 32.31% in 2013) Royce Micro Cap Trust (RMT) Total Returns (e.g.: down 46.1% in 2008 and up 50.14% in 2013)When I look at those total performance numbers, the argument for trading positions jumps off the page, though I have generally held a position for several years building it up gradually.
SEC Filings for Royce Value Trust
SEC Filings for Royce Micro-Cap Trust
Other risks are discussed by the sponsor.
Nuveen Municipal Income Fund 2 (NPM):
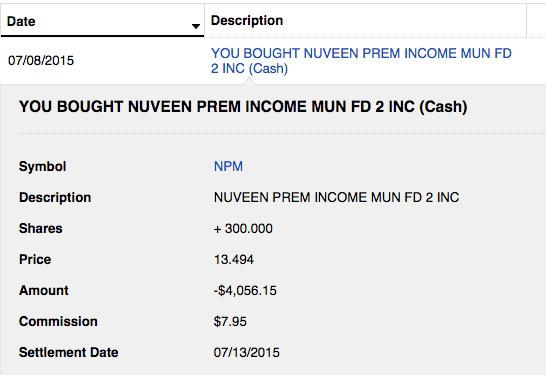
I have received one monthly dividend so far. The last ex dividend date was 7/13. The distribution was $.072.
Sponsor's Webpage: NPM - Nuveen Premium Income Municipal Fund 2, Inc. (as of 6/30/15, 381 holdings; adjusted effective duration at 13.01 years-more about duration later)
Rationale and Risks:
1. Tax Free Income-Lack of Return of Capital: NPM owns municipal bonds, and consequently its dividend payments will be mostly tax exempt when held in a taxable account. Some ordinary income may be generated through short term capital gains
The dividend yield at my total cost number is based on the current distribution rate which of course may change.
Both Morningstar and CEFConnect show no recent dividend support from return of capital, so the entire dividend has recently at least been supported by income.
SOURCED: Click Distribution Tab at CEFConnect
NPM Page at Morningstar (currently rated two stars-no analyst report)
The non-existence of ROC dividend support can also be confirmed by looking at the shareholder reports. For the year ending 10/31/14, dividends were sourced as shown in this table:

Sourced: Page 88 of Semi-Annual Report
Some funds may support their distributions with long term capital gains which are a less reliable source than interest payments made by the municipal bonds owned by the fund.
NPM had as of 4/30/15 an unused tax loss carryforward of $18.604+ million (same page 88).
Until that loss is used to offset long term capital gains, NPM will not source dividend support from LT gains. The fund utilized $4.844+M in capital loss carryforwards during its 2014 fiscal year ending 10/31/14 (same page 88).
There are three schools of thought about loss carryforwards.
A. For a new investor, some investors may prefer the tax shelter characteristics with the older shareholders experiencing the losses.
B. For investors who prefer to have income, the utilization of the loss carryforward deprives them of dividends that they want to have.
C. The mere presence of a tax loss carryforward incurred during a powerful long term bond bull market can raise at least some questions about the managers. In the case of NPM, the unrealized gains far outstrip the loss carryforwards. I would have a different opinion where there is a significant loss carryforward and the bond fund has minimal unrealized gains, or worse, unrealized losses.
As of 4/30/15, NPM had $123.638+M in net unrealized gains (page 87).
The preceding statistics and many others need to be consulted whenever an investor is considering a purchase IMO. That is simply one small part of making an informed decision. A $4K investment is not peanuts for most investors.
2. Leverage: I have only cash accounts and have never borrowed money to buy a security. I will buy in small amounts closed end funds that use borrow money to generate more income than an unleveraged fund owning the same securities.
NPM is a leveraged CEF. The leverage was 38.3% as of 6/30/15.
The annualized borrowing rate was 1.18% for the 6 months ending 4/30/15 (page 85).
The fund is able to earn additional income through the spread between the cost of funds and the yields from securities bought with that borrowed short term money. When short term rates start to move up, the spread will narrow.
In a bull market for municipal bonds, the fund is also able to generate gains from bonds purchased with borrowed money.
Leverage of course increases both potential risks and benefits.
3. Discount-Higher Than Historical Averages: When I bought this 300 lot, the fund was trading at an unusually large discount to its then net asset value per share.
4. Risks and Benefits Relating to CEF Market Pricing: As shown in the following table, the net asset value per share has increased from $15.08 to $15.26 over ten recent trading days. The market price has decreased by $.07 per share during that period as the net asset value per share has gone up $.18. That $.25 cent per share differential has increased the discount from -11.21 to -12.71%.
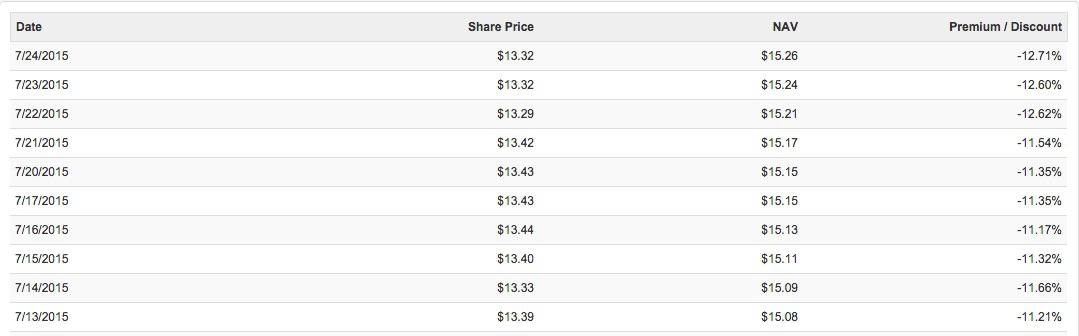
For a new investor, a lower price with the constant dividend amount creates a higher yield as well as a greater opportunity to profit later by a subsequent narrowing of the discount
Trading in CEFs is dominated by individual investors who frequently make irrational decisions. Irrational pricing decisions is a known hazard to CEF investors. CEF market pricing can also provide potential rewards to those willing to assume the risk of continued selling pressure that expands the discount after purchase.
The triple whammy is for (1) the discount to expand after purchase; (2) the net asset value declining in tandem due usually to a rise in rates for an investment grade bond fund (credit fears may come into play as in 2008); and (3) a rise in short term rates that raise the fund's borrowing cost.
5. Credit Quality: NPM is weighted in "A" or better rated municipal bonds:
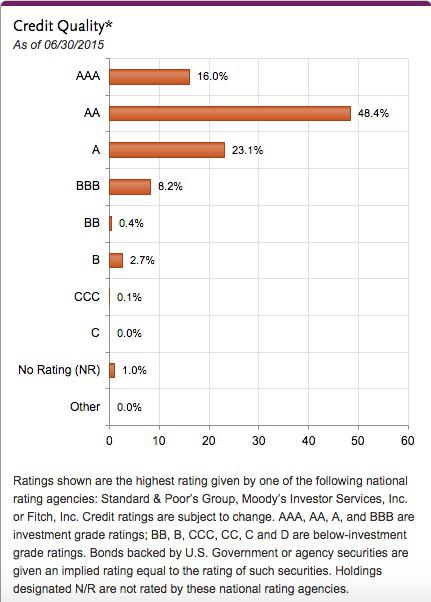
Sourced: Click Holdings and Detail Tab at NPM.
I am consequently more concerned about interest rate risk than credit risk.
5. Duration-Potentially Good or Bad Depending: The adjusted effective duration was 13.01 years as of 6/30/15. Leverage increases duration.
Earlier this year, I sold out of leveraged bond CEFs with durations over 5 years when interest rates started to move up.
Generally speaking, and just as a rule of thumb, a 1% rise in interest rates will cause a bond fund with a 13.01 duration to lose 13.01%.
Evaluating Bond Funds-Investopedia
Schwab 2014 Publication Bond Funds
Duration-What an Interest Rate Hike Could Do to Your Bond Portfolio | FINRA.org
Blackrock Understand Duration in Bond CEFs
Similarly, a 1% rise in rates will cause about 13%. Duration increases interest rate sensitivity.
With rates starting to trend down, I elected to nibble at two long duration municipal bond funds as TRADES. A reversal in the current interest trend, resulting in a persistent rise in intermediate to long term rates, will hopefully cause the Old Geezer to jettison NPM and NPF discussed below.
6. Lack of Redemption Risk: An investor in a bond CEF can not sell shares back to the fund. Shares in a bond CEF have to be sold just like a stock. Consequently, with a fixed capitalization, the investors in a bond CEF do not face the "redemption risk" inherent in the mutual fund or ETF structure.
Investors have a bad tendency to buy when an asset class is hot and to sell at the first sign of trouble.
Historically, bond fund managers have faced redemptions when bonds are falling in price. Depending on the fund and the amount of the redemption requests, the manager may have no choice but to sell into a declining market, thereby permanently locking in lower net asset values for the remaining shareholders.
The manager of the CEF bond fund does not have to sell anything since the shareholders have no right to compel a fund redemption. The CEF manager still may make abundant mistakes selling into panics or otherwise selling an inopportune prices. But those kind of mistakes are not forced by redeeming shareholders.
I will be reinvesting the dividend to buy additional shares. I bought at the same time a similar municipal bond CEF, NPF, where I am taking the dividends in cash. I am more likely to jettison it quickly assuming a share price pop which has not happened yet.
Nuveen Premier Municipal Income Fund (NPF)
Data as of Date of Purchase 7/8/15
Net Asset Value Per Share: $15.25
Market Price: $13.54
Discount: -11.21%
Average Discounts as of 7/24/15
1 Year: 10.78%
3 Years: 8.46%
5 Years: 6.45%
Sourced: Pricing Information Tab at CEFConnet
CEFConnect Page for NPF
I have traded municipal bond CEFs opportunistically.
I will generally buy several municipal bonds CEFs and then throw them out one by one as shown in this snapshot:
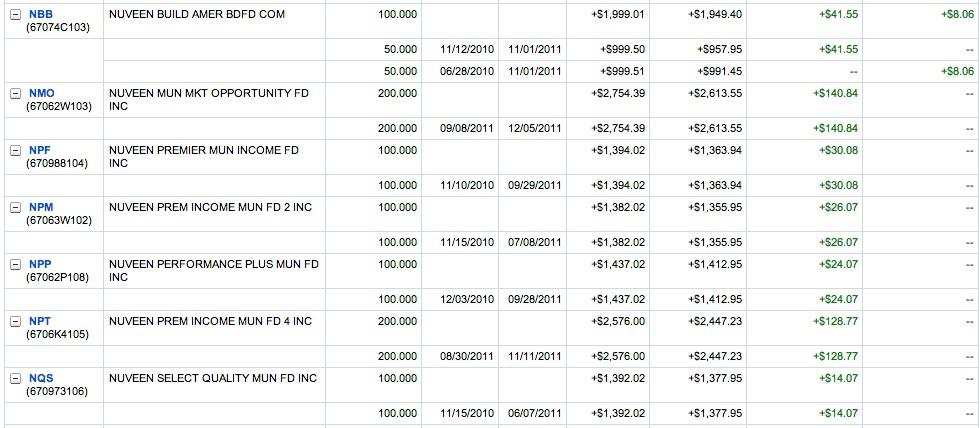
Looking at that montage, I see that I previously sold NPF at around $14 and NPM near $13.9.
NPF's Discount as of 7/28/15= -11.91%
3 Year Average Discount= 8.04%
5 Year Average Discount= 6.25%
Yield at Today's closing price of $13.09= 6.29%; tax equivalent yield as calculated by CEFConnect = 9.68%
In addition to Nuveen sponsored municipal bond CEFs, I will meander into Blackrock municipal bond CEFs:
![]()

Looking at that BKK trade, it was a quickie and I sold around $16.8. I noted that the current trades were near $15.5-$15.6.
I am just looking at it day-to-day for a possible re-entry.
Nuveen Diversified Dividend & Income (snapshot of trade in Appendix)
Rationale: Broad Exposure to Four Categories of Income Securities: Senior Floating Rate Loans, Dividend Stocks, REITs and Emerging Market Sovereign Debt; Dividend Currently About 9.33%; Increase in the Discount and Decrease in Price Since Last Transaction; Modestly Successful Prior Trading History; Recent Interest Rate Trend Down; Possible Flip Oppurtunity-SMALL BALL
CEFConnect Page for JDD (31.11% leveraged as of 6/30/15)
Sponsor: JDD - Nuveen Diversified Dividend and Income Fund
Last SEC Filed Shareholder Report: Period Ending 3/31/15
I have nothing to add to my prior discussion published last January, except to note the price decline and the increase in the discount:
Increasing Cash Flow: Bought Back JDD At $11.65 - South Gent | Seeking Alpha
Nuveen Diversified Dividend and Income Fund (JDD) Dividend HistoryMFS MultiMarket Income Trust (MMT)(snapshot of trade in Appendix)
Rationale: Broad Exposure to Bond Market; Large Increase in the Discount Since the Last Transaction; Good Dividend Yield at Current Price (junk bonds still under pressure as treasuries rise in price however); Interest Rates Have Been Trending Down Recently (10 year treasury closed at a 2.23% yield on 7/27/15 down from 2.44% on 7/13/15; Possible Flip Opportunity-SMALL BALL; Modest Duration at 5+ Years (see snapshot below)
CEFConnect Page (15.25% leveraged as of 4/30/15)
Sponsor: MFS Closed-End Funds
Last SEC Filed Shareholder Report: MFS MULTIMARKET INCOME TRUST (period ending 4/30/15; unrealized gain $7.1+M)
Weighting Average Annual Borrowing Costs: .83% (page 52)
Credit Quality and Duration (5.3 years as of 4/30/15)
Page 2 of Report:
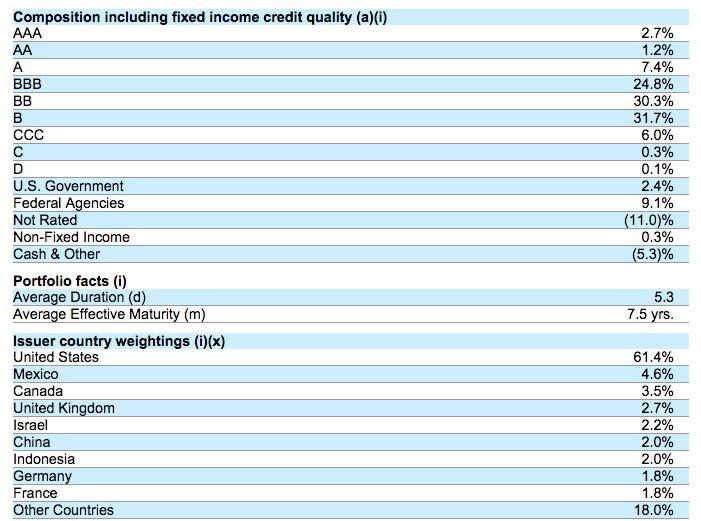
The fund will do some currency hedging.
New America High Income Fund (HYB): Averaged Down
HYB is a leveraged junk bond fund.
Bought 100 Shares at $8.38
Sponsor's Website: Welcome to New America High Income Fund Home Page
CEFConnect Page for HYB
HYB Page at Morningstar (rated 4 stars; shows no ROC)
Last SEC Filed Shareholder Report: Q/E 3/31/15 (near break-even on net realized gains/losses)
Leveraged at 27.52% as of 7/27/15 (based on a spread to Libor)
Weighted Average Borrowing Rate for 2014 was 1.06%: Page 31.
This CEF reports net asset value only on a weekly basis.
As of 7/24/15, the NAV per share was reported at $10.01. Based on a then closing price of $8.41, the discount was at -15.98%.
Average Discounts:
1 Year: -11.63%
3 Years: -7.2%
5 Years: -4.23%
Dividends are paid monthly. The current rate is $.065 per share or $.78 annually. Assuming a continuation of that rate, which is in no way assured, the dividend yield would be about 9.31% assuming a total cost per share of $8.38.
Recent Special Dividends: There was a $.12 per share special distribution last December. The fund paid a $.145 per share special distribution in December 2013 and $.25 per share in December 2012.
APPENDIX:
In this Appendix, I am attempting to illustrate my thought and trading process for CEFs.
Nuveen Diversified Dividend & Income Fund (JDD)JDD Recent Trades:
1. Item # 2 Sold 100 of the CEF JDD at $12.45-Roth IRA (Trade Date 3/5/15)(profit snapshot=$66.98 +$78 in dividends)
Sell Trade Date 3/5/15:
Closing Price: $12.48
Net Asset Value Per Share:$13.99
Discount=-10.79%
2. Bought 100 JDD at $11.64 in Roth IRA (4/12/14 Post)
Purchase Trade Date 4/4/14:
Closing Price: $11.6
Net Asset Value Per Share: $13.29
Discount: -12.72%
Total Average Annualized Return=15.59%
Sourced: Dividend Channel
***
3. Bought Back JDD At $11.65 - South Gent | Seeking Alpha
Purchase Trade Date: 1/6/15
Net Asset Value: $13.51
Discount: -13.62%
4. Sold at JDD at $12.44
Trade Date: 4/30/15
Net Asset Value: $13.67
Discount: -9.58%
Profit: $63.07 +$27 Dividend=$90.07 or 7.68% Total Return (holding period: almost 4 months)
![]()
****
5. Bought Back 100 of 200 JDD at $11.45
Trade Date 7/27/15
Net Asset Value Per Share: $13.21
Discount Based on $11.45= -13.4% (based on $11.44 closing price)
Average Discounts:
1 Year: -11.49%
3 Years: -8.59%
5 Years: -8.29%
Sourced CEFConnect Under Pricing Information Tab
A 8.21% discount would produce a 5% gain at a constant $13.21 net asset value. JDD closed at a -8.03% discount on 5/21/15.
![]()
JDD Historical Trades
Item # 4 Sold 150 JDD at $12.25 (7/19/14 Post)(profit snapshot=$66.25 + one quarterly dividend)-Item # 3 Bought 150 JDD at $11.7 in Taxable Account (4/12/14 Post)(contains snapshots of prior trading gains of $430.98)
Item # 4 Sold CEF JDD at $11.28 (July 22, 2011 Post)-Item # 6 Bought 100 JDD in Roth at $8.4 (August 2009 )and Item # 5 Added to CEF JDD at $9.45 (October 23, 2009 Post)
Item # 4 Sold 70 of 170 of JDD-Roth IRA (2/26/2010 Post)(part of 100 share lot bought at $8.4 August 2009)-Item # 6 Bought 100 JDD in Roth at $8.4
Sold 300 JDD at $11.44 (December 6, 2010 Post)-Bought 300 JDD at $10.95 (September 10, 2010 Post)
Total Trading Gains: $560.3 plus dividends
Discount as of 7/28/15: -13.35%
+++++++++++++++++++++++++++++++++++++++++++++
MFS Multimarket Income Trust (MMT)Snapshots of Trading History:
1. Trade Date 7/27/15: Bought Back 300 Shares at $5.95:

Closing Price $5.92
Net Asset Value: $6.94
Discount: -14.7%
In addition to monthly dividends, MMT did declare two special dividends since my last transaction:
December 2014: $.12897 per share
December 2013: $.1691 per share.
If I adjust the 7/27/15 net asset value per share by just those two special dividend, the adjusted NAV would be $7.2381. Most of the decline is attributable to an expansion of the discount.
2. Last Round Trip-2013 Roth IRA 300 Shares +$217.15
Sold 4/22/13
NAV PER Share: $7.74
Market Closing Price: $7.55
Discount: -2.45%
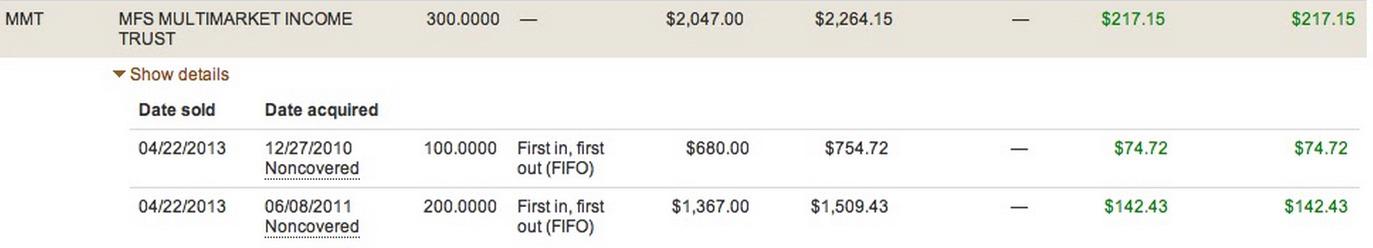
Total Average Annualized Return 200 Share Lot=13.11%
Total Average Annualized Return 100 Share Lot= 11.41%
Sourced From Dividend Channel
3. 2012 Taxable 300 Shares +$26.66
![]()
Sold 2/24/12 NAV= $7.39;
Discount= -3.65%
Market Price=$7.12
Bought 9/30/10
Total Average Annualized Return: 9.28%
4. 2012 Satellite Taxable 301+ Shares +$84.07
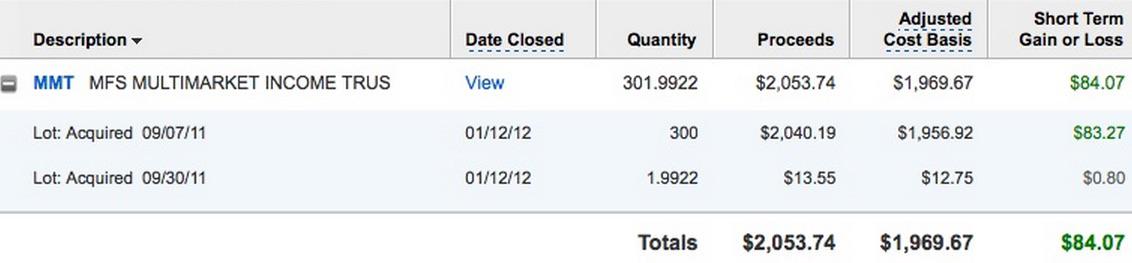
Total Return About 8.51%
5. 2011 Satellite Taxable 300 Shares +$64.1

Total Return About 6.89%
6. 2010 Regular IRA 100 Shares +$6.35
![]()
If I had held the lot bought in 2010 until 7/27/15, the average annualized total return would be 5.1% or less than the dividend yield when taking cash.
Total Trading Gains: $398.33 plus dividends (a return in excess of the dividend yield which is the goal given the already high dividend yield and a total return higher on all trades then the total return from a long term hold starting in November 2010)
+++++++++++++++++
Royce Micro-Cap Trust (RMT)2014 Elimination:
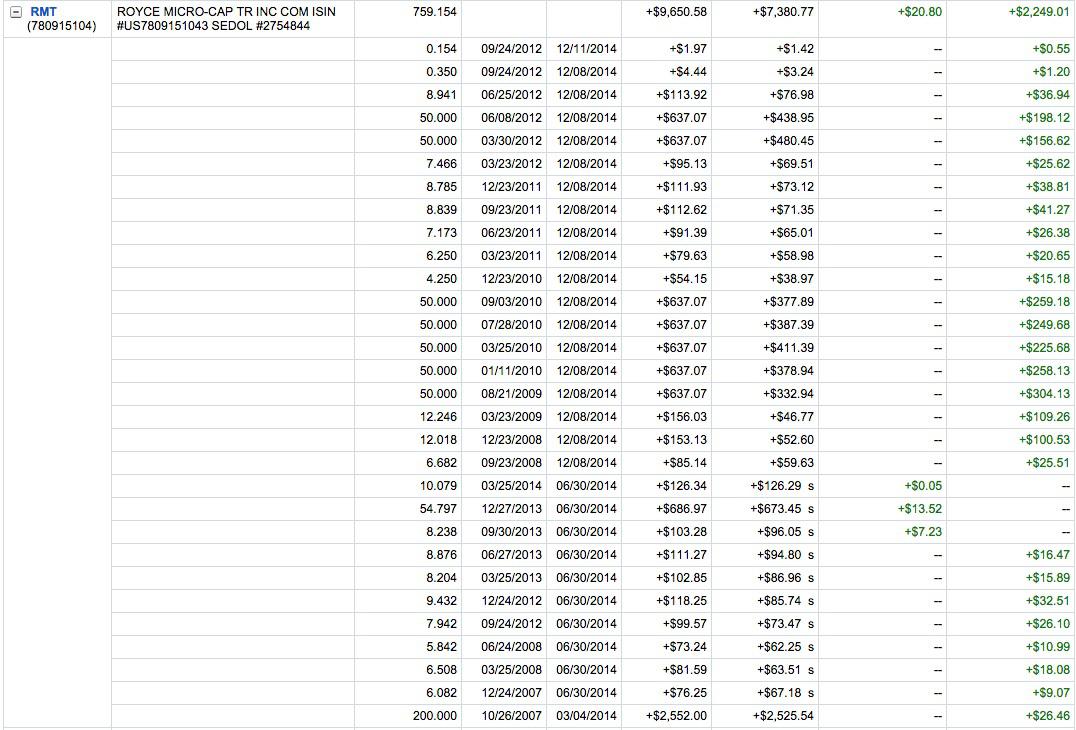
Last Sell Trade Date 12/08/14:
Closing Market Price: $12.57
Closing Net Asset Value Per Share: $13.16
Discount: -4.48% (rose to 7.17% the next day)
Dividends Paid 12/8/14 through 7/28/15=$2.3712 per share
12/8/14 Net Asset Value Adjusted For Subsequent Dividends=$10.79 per share
12/8/14 Market Price Adjusted for Subsequent Dividends=$10.2
New Purchase at $8.63 or 15.39% below the adjusted 12/8/14 market price-New Entry Point Established for Gradual Position Build
Discount As Of 7/28/15= -13.43%
3 Year Average at -11.62%
Disclaimer: I am not a financial advisor but simply an individual investor who has been managing my own money since I was a teenager. In this post, I am acting solely as a financial journalist focusing on my own investments. The information contained in this post is not intended to be a complete description or summary of all available data relevant to making an investment decision. Instead, I am merely expressing some of the reasons underlying the purchase or sell of securities. Nothing in this post is intended to constitute investment or legal advice or a recommendation to buy or to sell. All investors need to perform their own due diligence before making any financial decision which requires at a minimum reading original source material available at the SEC and elsewhere. Each investor needs to assess a potential investment taking into account their personal risk tolerances, goals and situational risks. I can only make that kind of assessment for myself and family members.