This basket was last updated here: Update For Exchange Traded Bond And Preferred Stock Basket Strategy As Of 10/15/15 - South Gent | Seeking Alpha
Investment grade U.S. bonds are declining in price so far today (Friday 10/23/15):
TLT: 123.32 -0.94 (-0.76%) at 10:53AM EDT
LQD: $117.37 -0.22 (-0.19%) at 10:53AM EDT
Junk bond ETFs are up some:
JNK: $36.58 +0.12 (+0.34%) at 10:55AM EDT
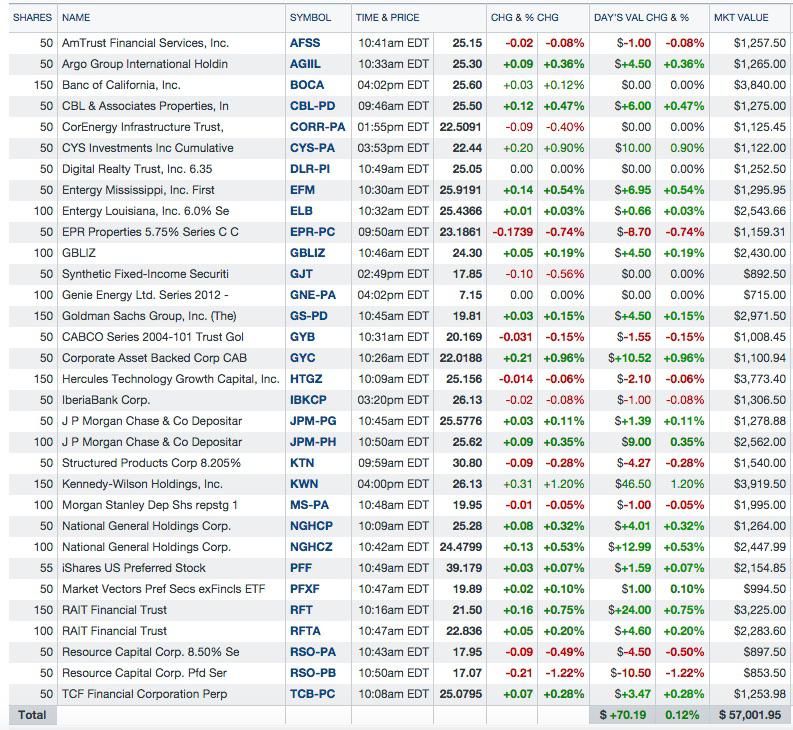
The following table includes only exchange traded securities. I do not have a table showing my existing $1,000 par value bonds bought in the bond market. I will discuss those bond market purchases here.
Basket as of 10/22/15:
With inflation and inflation expectations remaining abnormally low, interest rate risk has currently become less important than other bond risks including currency, credit and country risks IMO.
Inflation expectations are currently low: 5-Year Breakeven Inflation Rate-St. Louis Fed;10-Year Breakeven Inflation Rate-St. Louis Fed
That number can easily be calculated as follows simply by subtracting the real yield from the nominal yield:
Daily Treasury Yield Curve Rates (non-inflation protected nominal yields)
Minus
Daily Treasury Real Yield Curve Rates
The general directional trends in interest rates is for higher quality and longer duration bonds to outperform.
This basket topped out near $150K, but had shrunk to less than $40K due to issuer redemptions and profit taking a couple of months ago. Update For Bond And Equity Preferred Stock Basket Strategy As Of 7/31/15 - South Gent | Seeking Alpha
Over the past few weeks, I have been adding to this basket some in small amounts based in significant part on the foregoing considerations.
Another consideration is simply a desire to generate tax free income in my Roth IRA accounts, when the money market accounts, which fund the purchases, generate nothing as a practical matter.
Deflationary risks have increased over the past year due to the declines in commodity prices, the parabolic rise in the USD which lowers import prices (WSJ), the recessions in several important economies (Brazil, Russia, Canada), the slowdowns in many others with China being the most important, and the persistent sluggishness in the Eurozone and Japan.
Over the past 12 months through September 2015, the government's CPI index was "essentially unchanged", driven down by the energy prices. Consumer Price Index Summary Core CPI rose at a 2.6% annualized rate in September.
Outside of energy, there are signs of incipient inflation pressures.
Core CPI was up 1.9% over the past year.
The last inflation report from the BLS had these Y-O-Y inflation numbers in it:
Medical care services +2.4%
Food 1.6%
Transportation services 2.2%
Shelter 3.2%
Services less energy services 2.7%
Medical care commodities 2.7%
The Atlanta Fed's Sticky Price Index was up 3.5% in September:
Sticky-Price CPI - Federal Reserve Bank of Atlanta
The Cleveland FED has another method of calculating the expected average annual inflation rate over the next ten years. The current estimate is for an average annual inflation rate of 1.74% which is close to the 10 year TIP break-even spread:Inflation Expectations: Latest News Release
Median CPI was hot in September, rising at an annualized rate of 3.4%, as calculated by the Cleveland Federal Reserve: Median CPI: Latest News Release
Inflation and inflation expectations are very important to fixed income investors, particularly given the current historically low yields. A small rise in interest rates can wipe out a year's worth of distributions.
For U.S. inflation, the most important deflationary pressure has been the decline in crude prices Y-O-Y. The substantial decline started during mid-summer 2014 and continued through February 2015.
Cushing, OK WTI Spot Price FOB (Dollars per Barrel)
That negative impact on inflation becomes neutral with WTI mostly moving in the $40 to $50 per barrel range next Spring. If WTI starts to trend above $60, then energy prices would start to contribute to Y-O-Y inflation numbers.
When energy prices turn back up on a sustained basis, the FED could be faced with 3%+ inflation rates and that might be a realistic prediction with crude fluctuating in the $60-$80 price range and natural gas prices mostly in the $3 to $4 (per thousand cubic feet) range. U.S. Natural Gas Wellhead Price (Dollars per Thousand Cubic Feet)
I would just say now that bond investors need to be extremely attuned to changes in inflation and inflation expectations now given the abnormally low interest rates and a possibility that inflation may gain momentum starting around next Spring.
1. Bought 50 TCBPRC at $24.68:
Trade Snapshot ($1 Commission):

Closing Price Day of Trade: $24.8 down -$.06 (range $24.68 to $24.88)
Security Description: The
TCF Financial Corp. 6.45% Non-Cumulative Preferred Stock Series B (TCB.PC) is an equity preferred stock that pays non-cumulative and qualified dividends at the fixed coupon rate of 6.45% on a $25 par value. Dividends are paid quarterly.TCF Financial is a bank holding company headquartered in Wayzata, MN. Through its operating bank subsidiary, TCF had 376 branches in Illinois, Minnesota, Michigan, Colorado, Wisconsin, Arizona, South Dakota and Indiana.
The issuer has the option to redeem this preferred stock on or after December 19, 2017. Interest rate risk is, as always, asymmetric in favor of the issuer.
The security may be redeemed earlier due to a "regulatory capital treatment event". A regulatory capital event relates to how regulators treat equity preferred stock in meeting capital requirements. The regulators currently allow banks to classify both equity preferred and common stocks as TIER 1 capital. Page 14 FDIC I do not see any reason why that would change in the foreseeable future. A capital treatment event would be a reclassification of equity preferred stock as TIER 2 capital.
At a total cost of $24.68 per share, the dividend yield is about 6.53%.
The prospectus has a typical dividend stopper clause that is summarized in the following snapshot taken for the prospectus:
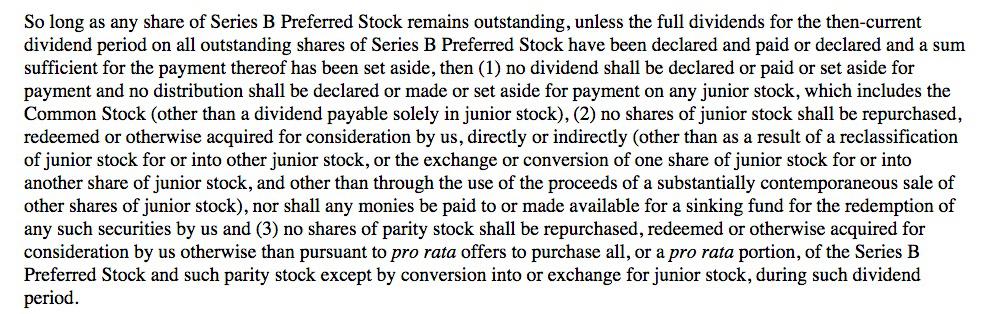
This clause is the legal means for enforcing a preferred stocks superior claim to income over the more junior common stock. An equity preferred stock is senior only to common stock in the capital structure and will be junior in priority to all bonds.
TCF Financial announced last Thursday a 50% increase in its common share dividend to $.075 per share. The bank had slashed the quarterly dividend to $.05 per share effective for the 2009 second quarter and has not raised it since that time.
Whatever is paid to the common shareholders in cash, the common cash dividend has to be eliminated before the company eliminates the non-cumulative preferred share dividend (cumulative dividends can be deferred, but not eliminated short of a BK)
The preferred share owner would generally want less money paid to the common share owner since that means more capital available to meet the preferred share dividend.
The owner of TCBPRC would be fine with a $.01 per share annual cash dividend paid to the common shareholders. There are some countervailing considerations however. A rising dividend accompanied by earning growth would send a signal of improving financial health and possibly cause the rating agencies to raise the credit rating. A preferred stock rated BBB- will generally command a higher price than one rated BB-, though the optional call date would cap potential appreciation in a declining interest rate environment.
According to Quantumonline, this security is rated BB- by S & P. Preferred stocks issued by bank holding companies are mostly rated in junk territory. There are a few exceptions including preferred stocks issued by WFC and JPM.
There are several reasons for the junk ratings, but the most important are the equity preferred stock's low position in the capital structure and the fact that the securities are issued by leveraged bank holding companies.
Without any question in my mind, a bank issued equity preferred stock would become worthless when and if the FDIC seizes the operating bank subsidiary of the bank holding company. That would almost certainly happen to junior bonds issued by that bank holding company as well, with senior unsecured bond owners scrambling and fighting for scraps.
Recent Earnings Report: I view it as important to review historical earnings information when buying an equity preferred stock or bond. The purpose is to form a judgment about credit risk rather than a fair value range for the common stock.
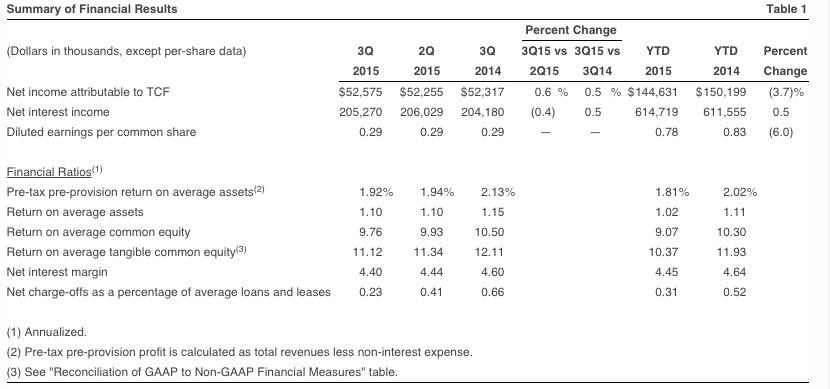
For the 2015 third quarter, TCF reported net income of $52.6M, up slightly from the $52.3M reported for the 2014 third quarter. E.P.S. was unchanged Y-O-Y at $.29.
The consensus E.P.S. was for $.29 and $1.08 for this year. The consensus forecast for 2016 is currently $1.22: TCB Analyst Estimates
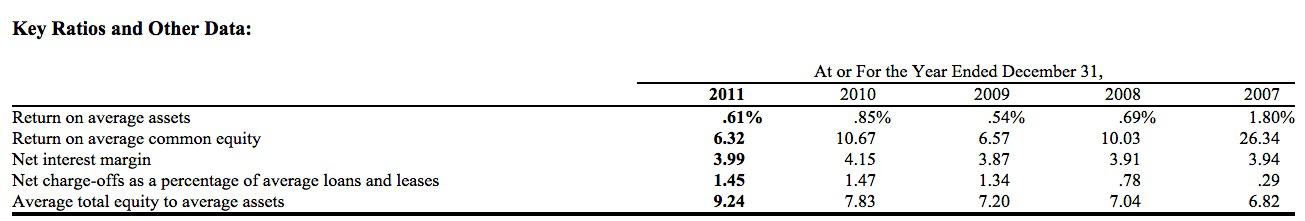
The lack of earnings growth is becoming a major problem for regional banks due in large measure to NIM contraction. TCF's NIM is significantly higher than the national average but has been trending down:
For the 2015 second quarter, the national average was 2.97%: Net Interest Margin for all U.S. Banks-St. Louis Fed
The ROA and ROE numbers are slightly above the national averages:
Return on Average Assets for all U.S. Banks-St. Louis Fed
Return on Average Equity for all U.S. Banks-St. Louis Fed
The nonaccrual loans are trending down and the charge-off ratio is below the national average:
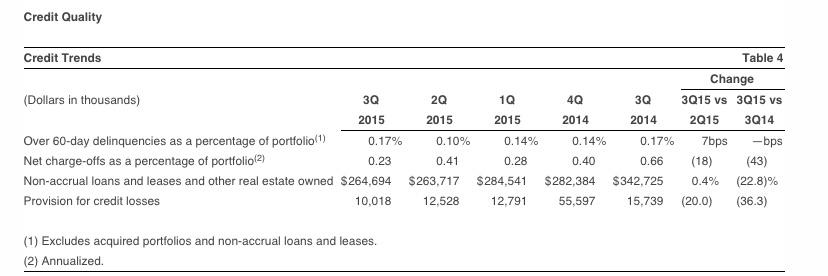
Total Net Loan Charge-offs to Total Loans for Banks-St. Louis Fed
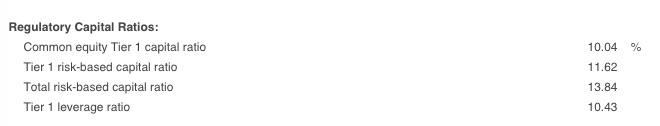
Capital ratios are currently okay IMO:
History: The Near Depression:
The recent Near Depression exposed banks who were making imprudent lending decisions. A serious recession will cause loan losses to spike even for the best managed banks. Those inevitable economic events will also expose those banks who have made too many poor decisions, which frequently will indicate a lack of good judgment by the Board and high ranking manager economic and/or a cowboy risk-taking culture throughout the bank that reflects badly on the entire operation.
When deciding to buy a regional bank's common or preferred shares, I will take a look at that history. The historical information can be found in the SEC Form 10-K: TCF Annual Reports
I took this snapshot from the 2012 Annual Report at page 18:
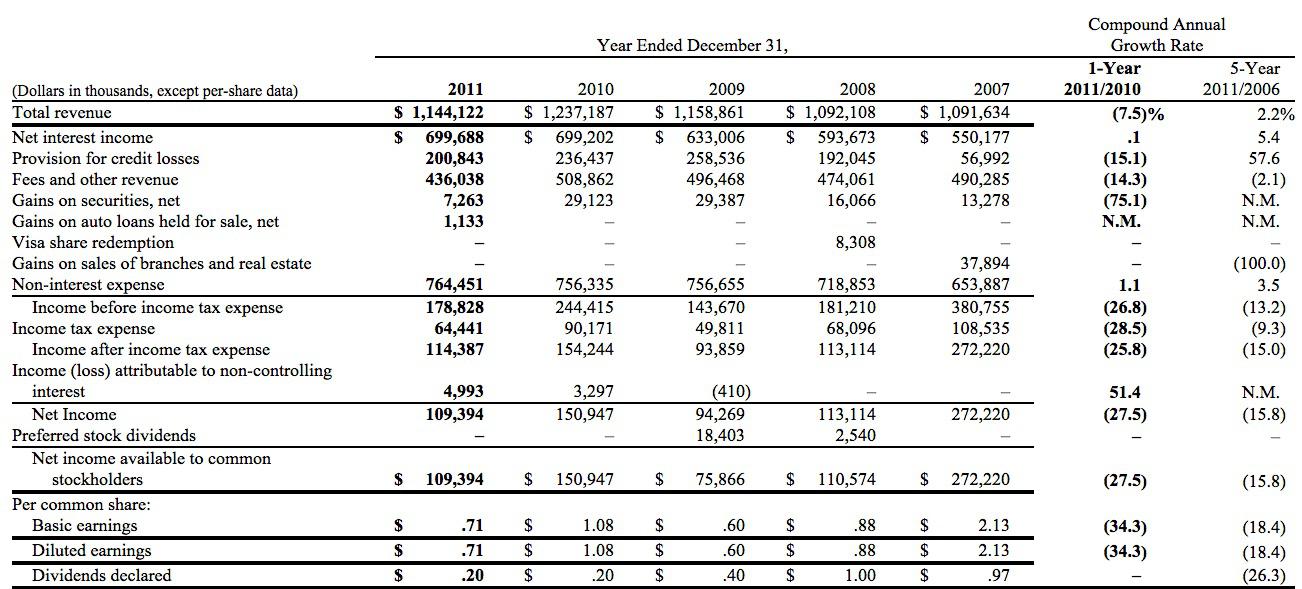
There are a few salient points revealed by this data. The bank remained profitable throughout the Near Depression period and its aftermath but was slow in recovering from it. I can also tell that TCF participated in TARP and redeemed the government's cumulative preferred stock in 2009.
Charge-offs continued to accelerate after the recession's official end:
Historical data for the 2012 to 2014 period can be found at page 17 of the 2014 Annual Report.
Disclaimer: I am not a financial advisor but simply an individual investor who has been managing my own money since I was a teenager. In this post, I am acting solely as a financial journalist focusing on my own investments. The information contained in this post is not intended to be a complete description or summary of all available data relevant to making an investment decision. Instead, I am merely expressing some of the reasons underlying the purchase or sell of securities. Nothing in this post is intended to constitute investment or legal advice or a recommendation to buy or to sell. All investors need to perform their own due diligence before making any financial decision which requires at a minimum reading original source material available at the SEC and elsewhere. A failure to perform due diligence only increases what I call "error creep". Stocks, Bonds & Politics:ERROR CREEP and the INVESTING PROCESS. Each investor needs to assess a potential investment taking into account their personal risk tolerances, goals and situational risks. I can only make that kind of assessment for myself and family members.