I am updating here this post: The Mechanics Of Purchasing A TIP In The Secondary Market - South Gent | Seeking Alpha
I discussed in that earlier post buying one treasury inflation protected bond in the secondary market: Bought One 1.875% TIP Maturing on 7/15/19-ROTH IRA
That was my first purchase of a TIP bond since 2009.
I can purchase TIPs in several accounts without paying a brokerage commission. I will only buy them in retirement accounts due to the tax issues explained here.
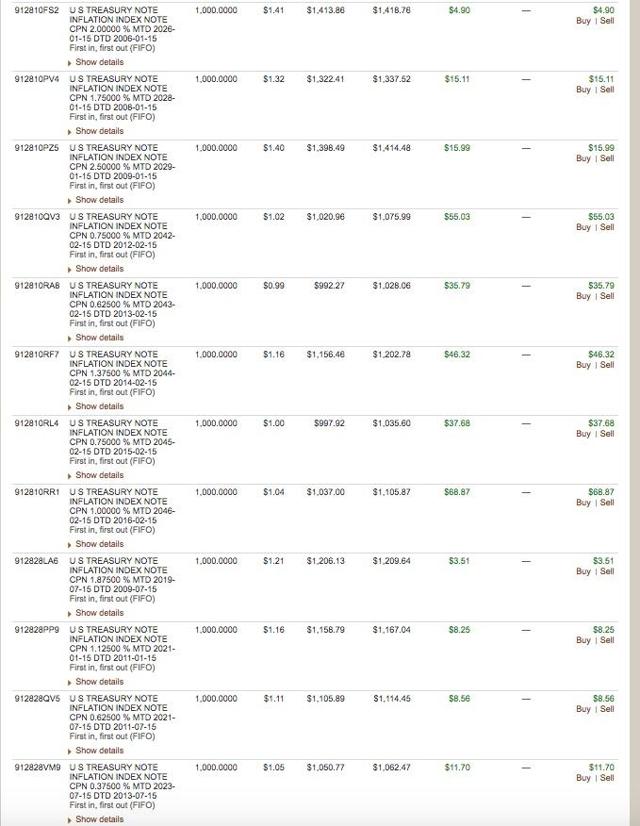
Subsequent to the repurchase of the TIP maturing on 7/15/2019, I purchased the following in my Vanguard Roth IRA account (snapshot after 7/19 close):
I filled in dates through purchases in another ROTH IRA account.
My unrealized gains are higher for the ones maturing in 2042, 2043, 2044, and 2046 than for the ones maturing between 2019 and 2029.
The reason for the outperformance of the long maturity TIPs is that the nominal 20+ treasury yield has gone up in price and down in yield since my purchases.
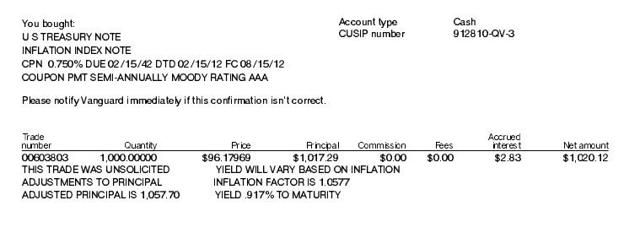
The following three trades were made on 6/14, 6/22 and 6/23:
When buying a vintage TIP in the secondary bond market, I have to pay accrued interest to the seller, which is the case of all bonds, and the principal amount as adjusted for inflation since issuance. Those adjustments are made every six months up or down as the case may be. The coupon is applied to the adjusted principal amount.
In the preceding snapshot, I paid 96.17969 for this bond or $961.769, yet I am shown paying a higher principal amount of $1,017.29 or $55.49 above what I would have paid for a non-inflation protected treasury. That is the principal increase over the original 1,000 par value caused by the TIP's inflation adjustment.
This adjustment is calculated using the "inflation factor" of 1.0577 shown in the confirmation. If I multiply that inflation factor by the paid $961.7969, you arrive at a $1,017.29 owed to the seller plus accrued interest. (inflation factor of 1.0577 x. 961.7969 in principal amount=$1,017.292581 rounded to $1,017.29 which is the number shown as the principal amount in this confirmation)
{Note that I did not pay to the seller the full amount of the $57.7 principal accretion. The seller lost $2.21 of that amount or 3.83% which is percentage difference between the $96.17969 price and the original $100 par value price. Pricing is at 1/10th of the $1K par value.}
The bond's value had gone down in price, unadjusted for the inflation factor, in order to make the .75% coupon of this bond roughly equal to the then current 25+ year TIP real yield.
This bond was originally a 30 year maturity, but was already 4+ years into that long cycle. So, without even looking, I know that the real yield for a comparable maturity TIP on the date of my purchase was slightly higher than .75%, and that was the cause for the price decline below par value. I actually bought this bond for less than its current principal amount of $1,057. This should cause the risk bells to go off in your head.
Two other confirmations for long dated TIP purchases:
Even though the TIP will have a significantly lower coupon than a comparable non-inflation protected treasury issued at about the same time, the value of the TIP coupon over time will be in part dependent on the comparable maturity yield of the non-inflation protected security. The risk bells just sounded again.
If the 20+ year non-inflation protected treasury yield rose from 2.2% to 4%, investors would demand a higher coupon for comparable maturity TIPs. That will cause vintage TIPs with lower coupons to fall in price and to rise in yield.
So far at least, I have benefited from a decline in the nominal long term treasury yields since my mid-June purchases.
The following snapshot shows the 10, 20 and 30 year treasury yields starting on 6/1/16 through 7/19/16:

Daily Treasury Yield Curve Rates
The reverse can happen; so I am more likely to trade the longer term maturities and to keep the others until they mature.
What happened during the interest rate spike in 2013 which started in early May and ended on 12/31/13. The ten year treasury yield went from 1.66% to 3.04%.
The 20 year treasury bond closed with a 2.44% yield on 5/1 and at 3.72% on 12/31/13. What do you think happened to the real yield of the 20 year TIP. That coupon rose from .04% to 1.36% during that same period. Do you think a buyer of the 20 year TIP on 5/1 was showing a profit or loss as of 12/31/13? The answer is clear.
That spike in rates was not caused by a change in inflation expectations which remained constant within in a narrow range. Inflation expectation numbers are easily calculated with the data contained in the previous paragraph.
The average annual inflation estimate over 20 years was estimated to be 2.4% on 5/1 and 2.36% on 12/31/13, going down some as interest rates spiked due to what I would call the first unsuccessful effort at interest rate normalization where investors price treasuries based on historical spreads to expected inflation rates.
The ten year historical spread is for a spread close to 2% over the anticipated inflation rate. The current rates are nowhere near that traditional spread, with the current ten year treasury barely providing a yield in excess of the abnormally low break-even spread.
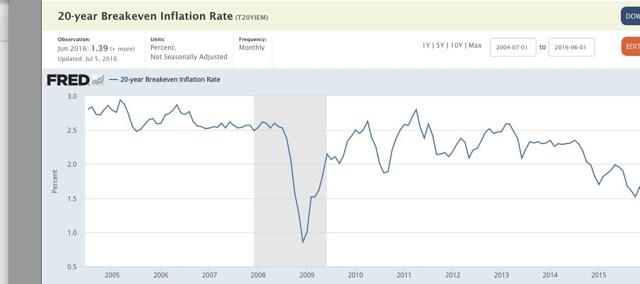
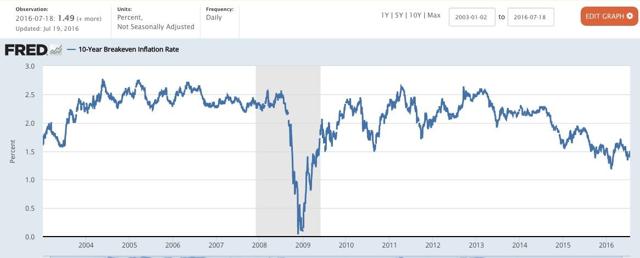
Another factor that will impact vintage TIPs is the break-even spread which is built into the price of TIPs. The break-even is the average annual inflation rate that is necessary for the lower coupon TIP to break-even with the higher coupon nominal treasury.
The break-even spreads for the ten and 20 year TIPs are abnormally low due to the Bond Ghouls forecasting low inflation until the end of days or close to it.
20-year Breakeven Inflation Rate-St. Louis Fed
Based on the closing prices as of
10-Year Breakeven Inflation Rate-St. Louis Fed
A rise in inflation expectations and/or a more normal spread than now to inflation expectations would cause investors to demand a higher coupon for the TIP.
I bought one TIP maturing in 2029 that had a 2.5% coupon that had a 1/15/2009 issue date and had to pay a premium for that coupon. The auction for that bond occurred on 1/26/2009.
As of 1/26/2009, when the world was still worried about Financial Armageddon, the coupon for the 20 year treasury closed at 3.71% and the break-even spread was lower than now at 1.24%. One might ask a silly question why the 20 year closed yesterday at a 1.91% yield under current U.S. economic conditions when the yield was at 3.71% when investors still feared a worldwide economic collapse and the onset of the Second Worldwide Great Depression. Is it because investors are setting interest rates free and clear of CB interference or are merely tagging along with CB created rates that are abnormally low?
Inflation expectations are too low IMO over 10, 20 and 30 year time frames. Maybe the expectations priced into the five year TIP will be close, but I even question that accuracy of that forecast. Yet, for as long as CBs maintain negative interest rates and negative real yields, and hoard large amounts of sovereign debt bought with funny money, the interest rate normalization process is likely to be postponed.
I decided to sell my longest maturity TIP that had risen the most in price since purchase:
Sold 1 TIP Maturing on 2/15/46
Profit Snapshot: 
I bought this bond at auction, when the treasury reopened this security that was originally sold in February. Auction Results When purchased in the secondary market, the settlement date for a TIP is one day after purchase whereas an auction will have a longer period before settlement. In this case, the auction was on 6/22 and the settlement, as reflected in the Auction Results link above, was on 6/30.
Note that my cost basis had increased to $1,037.26 from $1034.49 or $2.77. That is the inflation accretion since purchase.
The inflation factor adjustment for each bond can be ascertained here: Institutional - TIPS/CPI Data
The relevant data for this 2046 TIP, Cusip # 912810RR1, can be found here.
CPI Index on Dated Date of 2/15/16= 236.94448
CPI Index on 6/30/16: 239.22337 Inflation Factor 1.00962 (settlement date for purchase)
CPX Index on 7/21/16 Settlement Date: 239.89003 Inflation Factor 1.01243
The inflation factor increased by .00281 during my brief ownership period.
The CPI data used is the non-seasonally adjusted index for all urban consumers: DATA
I may not be alive when that 30 year TIP matures.
Thirty Year TIP Yield on 6/22/16 Purchase Date= .9%
Thirty Year TIP Yield on 7/20/16 Sell Date= .67%
Thirty Year Nominal Yield on 6/22/16= 2.5%
Thirty Year Nominal Yield on 7/20/16= 2.3%
Break-Even Spread on 6/22/16: 1.6% (anticipated average annual inflation rate over the next thirty years)
Break-Even Spread on 7/20/16: 1.63%
I can with some certitude that a TIP will be a better investment than a nominal treasury maturing at the same time when the average annual inflation rate over the life of the TIP is higher than the break-even spread at the time of purchase and the comparison would be to a purchase of the nominal treasury when the TIP is bought. That is not saying much, is it?
And, it is clear that the pricing of TIPs is more complicated than nominal treasuries due to the inflation protection component that causes the bond's principal amount to change.
++++++++++++
Update 10/26/16:
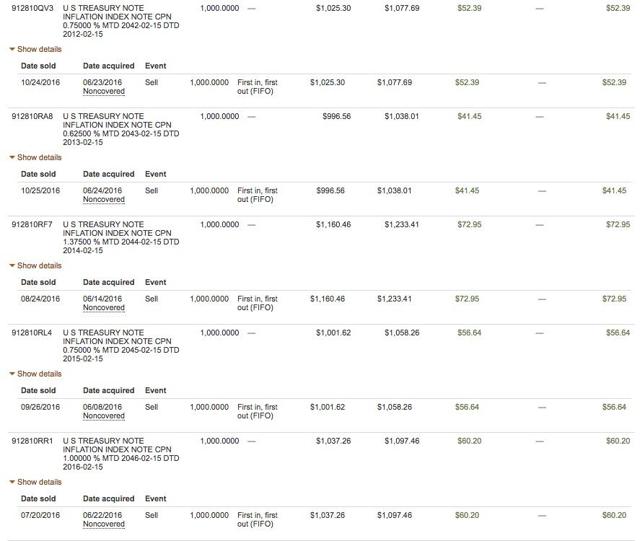
I have now sold the 5 TIP bonds maturing after 2040 that were bought in June 2016. The total realized gain was $283.63:
I will use the proceeds to buy TIPs maturing between 2024 and 2030 when and if I am able to reduce my average cost per bond.
The long duration TIPs will go down in price when nominal rates rise. The yields for the 20 and 30 year nominal treasuries were 2.17% and 2.5% as of 10/25/16 respectively. Daily Treasury Yield Curve Rates
If those nominal rate went up to 3% and 3.5%, still well below their historical averages, I would anticipate the real coupon yields to rise as well and the price of a vintage TIP with the same maturity, but a lower coupon, would have to decline in price to compensate.
The real yield on the 30 year TIP was .65% as of 10/25/16, creating at that time a 1.85% break-even inflation number (the annual average CPI over the next 30 years for the buyer of the 30 year TIP to just break-even with the buyer of the nominal 30 treasury): Daily Treasury Real Yield Curve Rates The 20 year TIP closed at a .46% yield.
Back in 2007, the 20 year TIP spent almost the entire year with a 2%+ real coupon and crossed 2.5% several times. Daily Treasury Real Yield Curve Rates
Disclaimer: I am not a financial advisor but simply an individual investor who has been managing my own money since I was a teenager. In this post, I am acting solely as a financial journalist focusing on my own investments. The information contained in this post is not intended to be a complete description or summary of all available data relevant to making an investment decision. Instead, I am merely expressing some of the reasons underlying the purchase or sell of securities. Nothing in this post is intended to constitute investment or legal advice or a recommendation to buy or to sell. All investors need to perform their own due diligence before making any financial decision which requires at a minimum reading original source material available at the SEC and elsewhere. A failure to perform due diligence only increases what I call "error creep". Stocks, Bonds & Politics:ERROR CREEP and the INVESTING PROCESS. Each investor needs to assess a potential investment taking into account their personal risk tolerances, goals and situational risks. I can only make that kind of assessment for myself and family members.
