The Regional Bank Basket Strategy was started in 2009.
Stocks, Bonds & Politics: REGIONAL BANK BASKET STRATEGY GATEWAY POST (snapshots of realized gains and losses near the end of that Post)
Stocks, Bonds & Politics: Regional Bank Stocks (12/23/09 Post)
My last update for this basket was in late September: Update for Regional Bank Basket Strategy (realized net gains through that date was $16,321.83)
Over the life of this strategy, I expect that dividends will provide about 40% of the total return.
1. Rationale for the Strategy:
Over the past 4 or so decades, I have seen banks blow themselves up several times.
Real estate loans are frequently the main culprit in those episodes, and the problems are aggravated by a recession at least partly due to the banks making improvident and/or recklessly imprudent loans. Those frequently foolish loans are written down, credit conditions tighten even for worthy borrowers, and borrowers teetering on the edge before the economic downturn default causing more problems for the economy and the banks.
The U.S. is currently recovering from the aftershocks of the latest banking fiasco precipitated by the Masters of Disaster who populate large financial institutions. The most recent episode was primarily caused by the improvident extension of home mortgage loans to clearly unqualified borrowers and by loans to developers of residential and commercial real estate. The origins of the crisis also involved widespread fraud in the origination of mortgage loans, both by borrowers and those who catered to unqualified borrowers. Many mortgage originators, now bankrupt, were nothing more or less than fraud factories.
All of those problems have been, and continue to be exacerbated by satanic creations such as Collateralized debt obligations Cubed and Squared.
A similar problem developed in the late 1980s and early 1990s. Some refer to this period as the savings and loan crisis, but the problems included commercial banks too. Fraud was prevalent then too, but more limited to some S & Ls and some of their commercial borrowers, rather than to individual homeowners. Lending to real estate developers was imprudent and reckless which is standard for banking fiascos. Problems were exacerbated by inflation and the 1990-1991 recession.
After this mess was cleaned up, the stocks of the survivors entered into a long term secular bull market, lasting until the most recent fiasco due largely to self-inflicted wounds. The shares of some bank stocks started to top out in 2005, others in 2006 or 2007, and the remainder during the Near Depression period (2008- early 2009). And, as one would expect, the stock prices for many of them cratered to prices last seen in the early or mid-1990s, as managers destroyed in many cases over two decades of value creation and were richly compensated for their mistakes. Many of those banks are still hovering at or near two decade lows.
Bankers will make the same type of mistakes over and over again. When business conditions improve, particularly during a long term bull cycle, they will pat themselves on the back as earnings and dividends increase virtually every year. Investors forget about the bankers' collective stupidity that caused the last near death experience. Many of the new generation of bankers, far more interested in bonuses for themselves than the financial health of their employers, will start to take on more extreme risks, based in part on a too rosy forecast about the future, as people start to assume that the next five years will be like the last five or ten.
In short, banks can not be buy and hold investments. Eventually, many of them will manage to destroy whatever value has been created under optimal financial conditions. Dividends that had been raised during the best of times will be eliminated or substantially reduced to preserve capital when the banks start to implode again due to reckless lending decisions.
Between those periods of self destruction, banks can prove to be worthwhile investments, and will provide a source of income. Several institutions will prosper and grow during the banking crisis since their managers were not inept or stupid during the period leading up to the implosion. Those banks will not lower their dividends and will frequently expand their operations during the crisis through FDIC assisted acquisitions of failed banks. And there has been a lot of failed banks over the past seven years.
The regional bank strategy is a long term strategy that will last at least for five years, but no longer than 10. I would not give the banks more than 10 years before the same cycle of destruction renews itself.
Criteria for Selections:
I will try to emphasize the several of the following financial criteria when making selections:
A. A dividend yield of over 3% based on my total cost, except for those banks bought in category 4 above.
B. Capital ratios well in excess of the minimum criteria for well capitalized banks. Regulatory Capital Categories
C. An efficiency ratios of less than 60%.
D. An allowance for non-performing loans to non-performing loans of more than 80%, preferably over 100%. As this number goes higher, I become more comfortable that the bank will not have a major earnings surprise due to a significant addition to its loan loss reserve.Assets at Banks whose ALLL exceeds their Nonperforming Loans (ALLL-Allowance for Loan Losses)
E. The ratio of non-performing loans to total loans less than 2%, except in category 4 referenced above where the number will invariably be greater than 2%. How well did the bank do during the Near Depression. If they kept NPLs less than 2% of total loans, then they are not wild and crazy, and may even be run by sensible people Nonperforming Loans to Total Loans St. Louis Fed Nonperforming Loans (past due 90+ days plus nonaccrual) Total Loans for U.S. Banks with average assets between $300M and $1B-St. Louis Fed Nonperforming Loans (past due 90+ days plus nonaccrual) / Total Loans for U.S. Peer Banks (with average assets less than $15B)
F. I want to see capital ratios significantly higher the minimum for banks viewed as well capitalized by regulators.
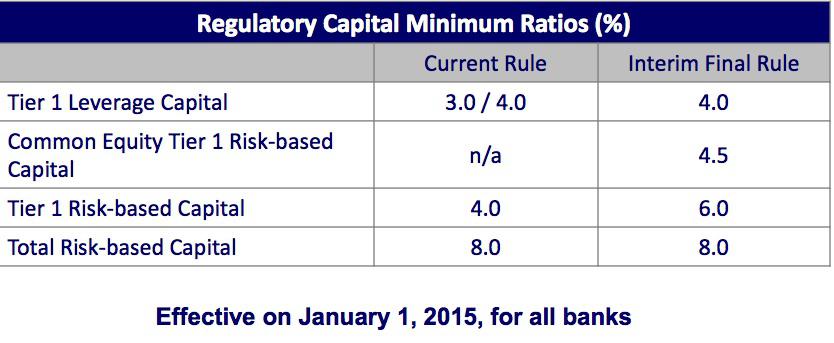
FDIC Slide Show on Interim Final Capital Rules to Implement Basel III ntFinalRule.pdf
G. I want to see the charge off ratio (charge offs to total loans annualized) moving down and to preferably be below .4%. Charge-Off Rate On All Loans, All Commercial Banks
H. I place an emphasis on banks that navigated the Near Depression period and its aftermath without cutting their dividend, avoiding annual losses, and refusing to accept TARP money.
I do not expect every selection to fit neatly into all of those preferences and some have flunked one or more of those criteria.
The abnormally low rates benefited banks some when deposit yields were repriced down in 2008-2010, but even 5 year bank CDs taken out in 2008 at higher rates have now matured. The positive impact of that repricing is no longer present to any meaningful degree.
Instead, the decline in rates for loans simply compresses net interest margin. When rates were rising last year, regional bank stocks were in an uptrend based on the common belief that higher intermediate and long rates would be a net positive for them, particularly when short terms were likely to remain near zero through mid-2015 and then rise slowly and modestly in 2016-2017. The rate spike starting last May impacted intermediate and long term rates. Short term rates remained anchored by ZIRP. It is not that simple however.
A more positive economy means more loans and fewer non-performing loans. Those two factors can be more important than net interest margin expansion, though a continued contraction in net interest margins due to a continuation of the FED's abnormal monetary policies will restrain earnings growth.
Many of the smaller regional banks suffered last year when their mortgage origination business declined significantly as mortgage rates went from extremely abnormal levels to less extreme abnormally low levels.
When I built my home in 1982, where I reside now in the SUV Capital of the World, I really had to pay cash for everything. The average 30 year mortgage rate was 16.04% with 2.2 points. Freddie Mac I really do not understand the reluctance of younger couples to buy a home that they can afford now.
Strategy Goals:
The overall goal is to generate a total annualized return close to 10%. I am focusing on stocks that pay dividends and provide a better than 3% dividend yield at my total cost per share.
Based on my total cost per share, I am above a 5% current yield in the following stocks and will likely a few more above 5% within the next year:
Dividend Yields 5% or higher: Based on Total Cost
NYCB: 8.44%
WASH: 8.34%
UBSI: 7.66%
CZNC: 5.39%
FNLC: 5.38%
CBU: 5.15%
TRST: 5.1%
CCNE: 5.%
Washington Trust is the one moving up the most after raising its quarterly dividend by 3 cents per share. The new quarterly rate will be $.32 per share ($1.28 per share annually). My total cost number for my remaining 50 shares is $767 or $15.34 per share. Since NYCB is unlikely to raise its dividend, I would expect WASH to surpass the dividend yield of NYCB next year based on my constant cost numbers.
***
That is enough of an introduction to the Regional Bank Basket Strategy. If I write another Instablog on a regional bank purchase, I will just refer back to this Post rather than discussing the foregoing again.
Added 50 ONB at $12.45 (see Disclaimer)
Snapshot of Trade:
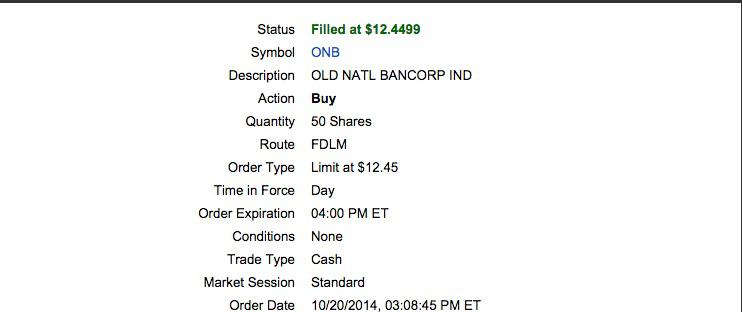
This is an average down from a 50 share purchase made earlier this year. Bought 50 ONB at $13.29
Old National Bancorp (ONB) is the largest financial services company headquartered in Indiana and is among the top 100 banking companies in the U.S. Its headquarters is located in Evansville, Indiana, a nice place with a riverboat casino parked on the Ohio River. I have been to Evansville more than once and have seen the ONB headquarter's building. (1 Main St - Google Maps)ONB now has more "than 170 banking centers" located across Indiana, Kentucky, Southern Illinois and Southwestern Michigan.Our History - Old National
Company Investor Relations Website: Corporate Profile - Old National
Old National Bancorp recently sold a public offering of $175 million in 4.125% senior unsecured notes due 8/15/24.
Dividend History: A Major Negative:
I will mention a negative right away. This bank cut its quarterly dividend from $.23 per share to just $.07 per share, effective for the 2010 first quarter. Dividends - Old National While the dividend has been raised since that slash, the current quarterly rate of $.11 per share is not even 50% of the pre-slash rate. While I understand the difficulties faced by banks during the last crisis, I still view that history negatively, and I view it as reflecting badly on management. Due to that issue and a few others, I have only had de minimis positions in this stock. I am now up to just 100 shares and that is actually my limit.
I did not own the stock prior to my first purchase noted below so I did not suffer from that particular fiasco as a long term holder.
Stock Chart-Major Negative: A long term stock chart is not a pretty sight. The bank was doing well recovering from the 1990-1991 banking disasters, sometimes known as the S & L crisis. The split adjusted price moved up from around $10 in 1991, topping out with an all time high near $26.5 in 1998. ONB Interactive Chart The stock then moved for almost 10 years mostly in a narrow channel between $18 to $24 before cratering in the 2008-2009 period falling back to near its 1991 price. Ouch. As I said, a large number of bankers never learn from the past, and are condemned to repeat it over and over again. Maybe they need to try harder in the future.
Prior Trades:
I have previously bought and sold Old National Bancorp twice as part of the regional bank basket.
Item # 1 Sold 50 ONB at $14.12 (7/6/13 Post)(snapshot of profit=$95.13)-Item # 4 Bought Back 50 ONB at $11.9 May 2013
Item # 1 SOLD 100 ONB at $13 (August 2012)(snapshot of profit=$99.07)-Item # 4 Bought 100 ONB at $11.85 (5/24/12 Post)
Total Realized Trading Gains=$194.2
My only observation about the foregoing history is that my last purchase was at least below my prior sell prices ($14.12 and $13).
Valuation and Dividend Yield: Positives
Current Consensus E.P.S. Estimates: Sourced from Yahoo Finance
2014: $.94
2015: $1.15
Y-O-Y Projected Growth: 22.34%
P/E at $12.45-2015 Estimate= 10.82
TTM P/E: About 13.6 at $12.5
Assuming that 2015 target estimate proves to be close, the stock is cheap at a forward P/E of 10.82 and a 22.34% anticipated growth rate in E.P.S.
Dividend Yield at the Current .11% Quarterly Run Rate-Assume Total Cost Per Share of $12.45=About 3.53%
If ONB raises the rate by one cent in the 2015 first quarter, the yield would rise to about 3.855%. ONB raised the quarterly dividend during both the 2013 and 2014 first quarters by 1 cent. A 2 cent per share raise occurred in the 2012 first quarter.
Expanding Geographic Footprint Through Acquisitions-Viewed as Positive:
Old National Bancorp has a long history of expanding its geographic footprint through acquisitions. Mergers & Acquisitions - Old National
The bank's website provides useful information about each merger. Some of the more recent ones include the following:
United Bancorp Completed 7/31/14-Expansion in Michigan
Tower Financial Completed 4/25/14-Partial Overlap in Indiana
Two mergers are pending completion: Founders Financial and LSB Financial
The benefits of recent acquisitions are discussed by the CFO, starting at page 2 of the last SA Earnings Call Transcript.
Capital Ratios-A Positive:
As of 6/30/14, the capital ratios are good:
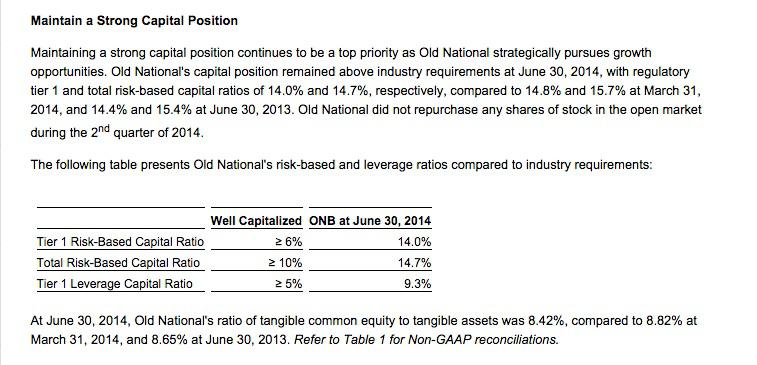
Last Earnings Report Noisy: I am not going to discuss in any detail the last earnings report since there was a lot of noise in it.
The bank reported net income of $18.8 million or $.18 per share. Those number included a $6.3M pre-tax merger and integration expense and a $10.5 million unfavorable pre-tax charge in an "indemnification asset".