Technically Speaking
RSI- the recent move up in the last two weeks has the stock back in bullish territory. The key to the immediate future will be to see if the next peak and valley can take place with more strength of not. This will reveal future direction for the market, but presently there is not enough information.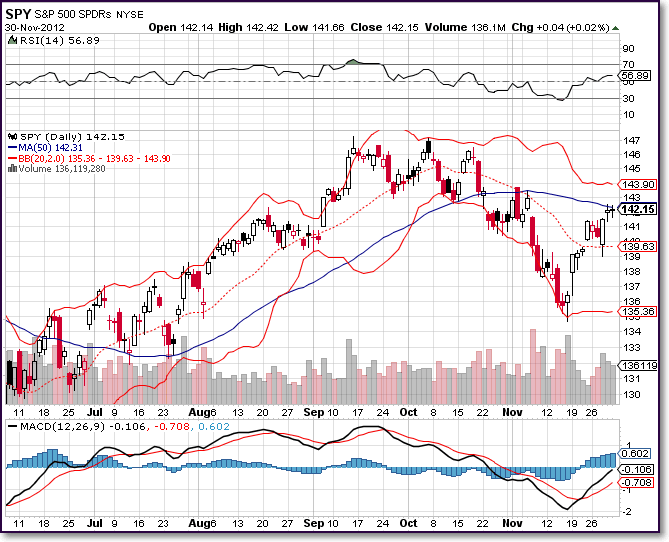
MACD- the MACD tends to mirror the RSI right now but one thing I observe is that the MACD MA's have not yet risen above the '0' level and is not in bullish territory like the RSI is. So if we want to observe strength, we want to see the MA's in bullish territory. The MA's are also still parallel and therefore look like they may continue to move up.
Bollinger Bands- first I see that we might have the 50 day MA become resistance now. It was once used as support and now could be opposite. As the stock moves up, if may push through the 50 Day and could see the upper band as resistance this time around. Still trying to determine which direction the stock will move after the last dip.
Current Events
In normal times, next week's slew of U.S. economic data could be a springboard for a December rally in the stock market.December is historically a strong month for markets. The S&P 500 has risen 16 times in the past 20 years during the month.
On Friday, the sharp divide between the Democrats and the Republicans on taxes and spending was evident in comments from President Barack Obama, who favors raising taxes on the wealthy, and Boehner, the top Republican in Congress, who said Obama's plan was the wrong approach and declared that the talks had reached a stalemate.
Disclosure: I have no positions in any stocks mentioned, and no plans to initiate any positions within the next 72 hours.