Please Note: Blog posts are not selected, edited or screened by Seeking Alpha editors.
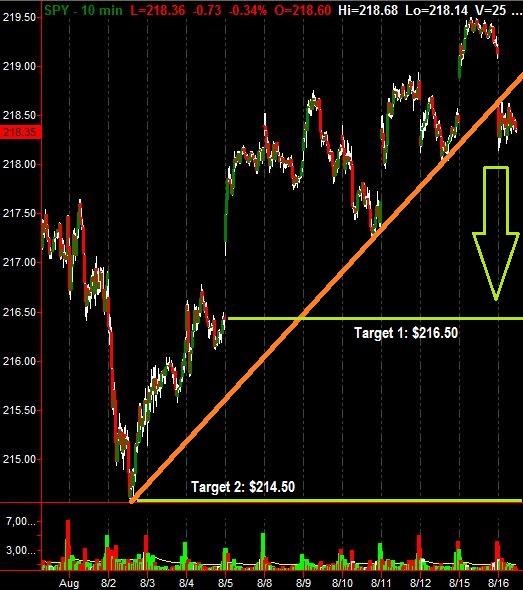
The S&P 500 tracking ETF $SPY opened below a key up-sloping trend line today. This trend line had held the stock market higher for the past week. With the break below, it signals a break down near term in the stock market. Over the next few days, expect the SPY to fall to $216.50 and then $214.50. Note the chart below.
Seeking Alpha's Disclosure: Past performance is no guarantee of future results. No recommendation or advice is being given as to whether any investment is suitable for a particular investor. Any views or opinions expressed above may not reflect those of Seeking Alpha as a whole. Seeking Alpha is not a licensed securities dealer, broker or US investment adviser or investment bank. Our analysts are third party authors that include both professional investors and individual investors who may not be licensed or certified by any institute or regulatory body.