I often find portfolio managers and investors describing themselves as top-down strategists. They look for trends at the macro level and apply their findings to individual trades. Spare me the humiliation of having skipped past rigorous scans that lie between the trends and the trading positions themselves, for I'm genuinely curious how these individuals prepare for an upcoming week. In lieu of my own curiosity I thought I'd offer an account of how I prepare for the week that lies ahead using technical analysis. Ah, now there's something new.
Looking for trends at the macro level translates into an analysis of a leading index, such as the Dow Jones Industrial (DJI). I find stocks model the Dow fairly consistently whilst allowing me to deduce simple but potentially profitable trends. Here's a look at the Dow Jones ahead of Monday's session, through my eyes.
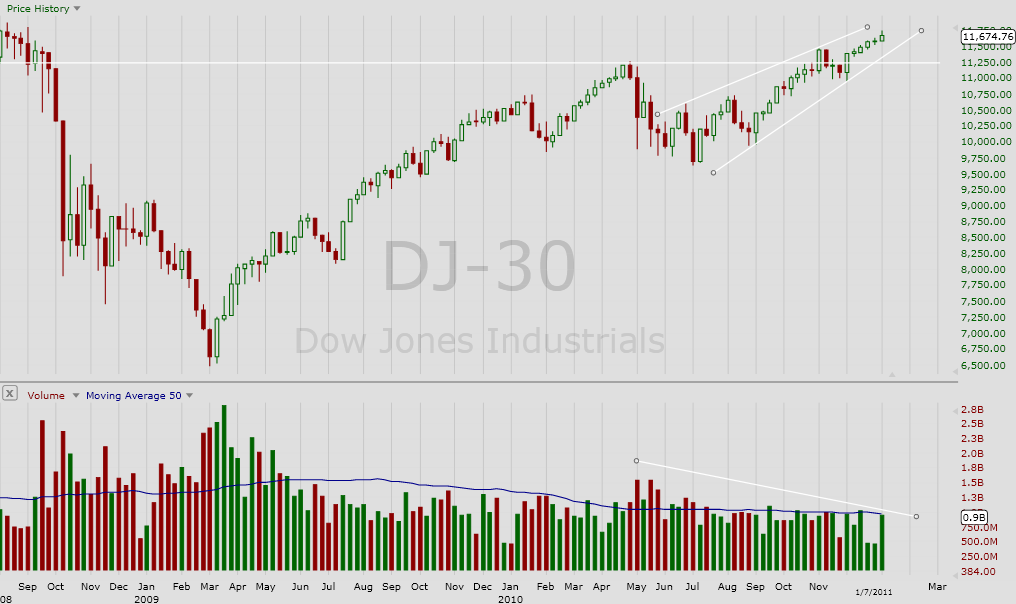
The Dow Weekly chart points to the formation of a bearish chart pattern termed 'rising wedge'. Simultaneously volume is seen declining in combination with rising price. This is called negative divergence. Both of these technical indicators warn of an impeding correction. It does not imply that we are headed for absolute chaos or destruction, but rather, that the markets will 'pull-back'. This lends way for some specific trading ideas. You might, for instance, knowing that the Dow trades downwards this week, short financial stocks. On the other hand you might use this knowledge to leverage your position in a bull or bear ETF, such as FAS or FAZ. But many will look to hedge with gold. Below is a look at SPDR Gold Shares (GLD) from a technical perspective.
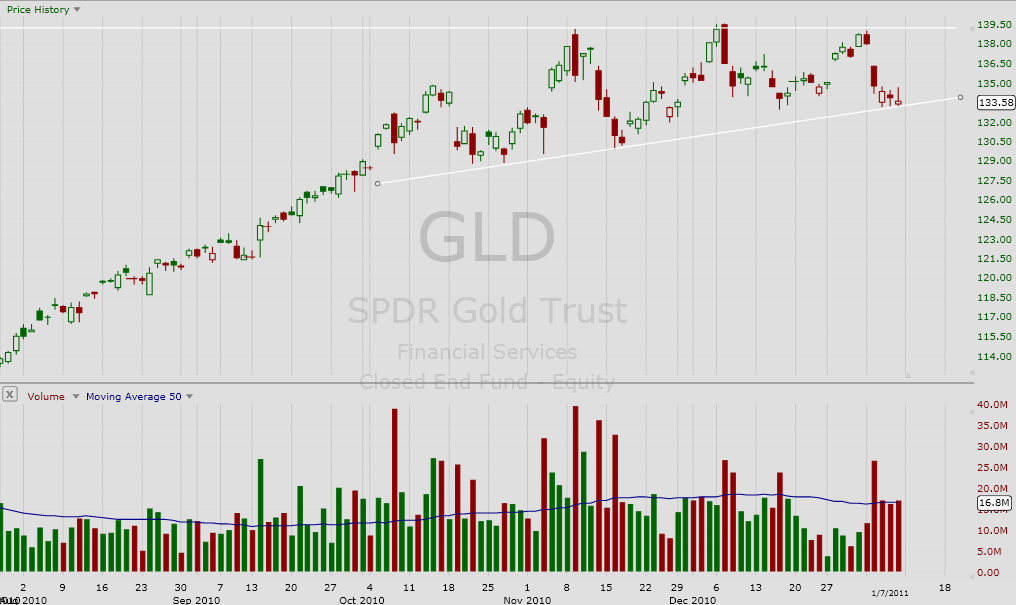
Conversely to the Dow, gold is currently trading at support and in the midst of a bullish rising wedge chart pattern (assuming support remains intact). Depending on the severity of a pull-back in the equity market, gold may find itself once again testing resistance and potentially breaking out to new all-time highs. So I'm inclined to believe that gold stocks may benefit from this trend.
But where does that leave other stocks? As far as I'm concerned as a technical trader, that depends on the severity of movement to either the downside or the upside in the equity market. A look at the economic calendar reveals that a significant portion of data isn't due until the latter part of this week. That tells me its unlikely that we will see a breakout, breakdown or significant movement until at least mid-week. This plays a crucial role, as I explain to my Premium subscribers, as it determines how you position yourself in trades that you've deemed appropriate based on earlier analysis (above).
It means there's room to speculate with some other trades while your core positions mature. Similarly this period allows you to build your positions. At the end of the day you look back at your initial choices and compare to the current situation. Ask yourself what has changed, why, and how you can adjust to better position yourself for optimum reward.
In part, that's what a technical approach to the trading week ahead may look like...at least it does for yours truly.
Disclosure: I have no positions in any stocks mentioned, and no plans to initiate any positions within the next 72 hours.