By Ed Wijaranakula, Ph.D., NMS Investment Research
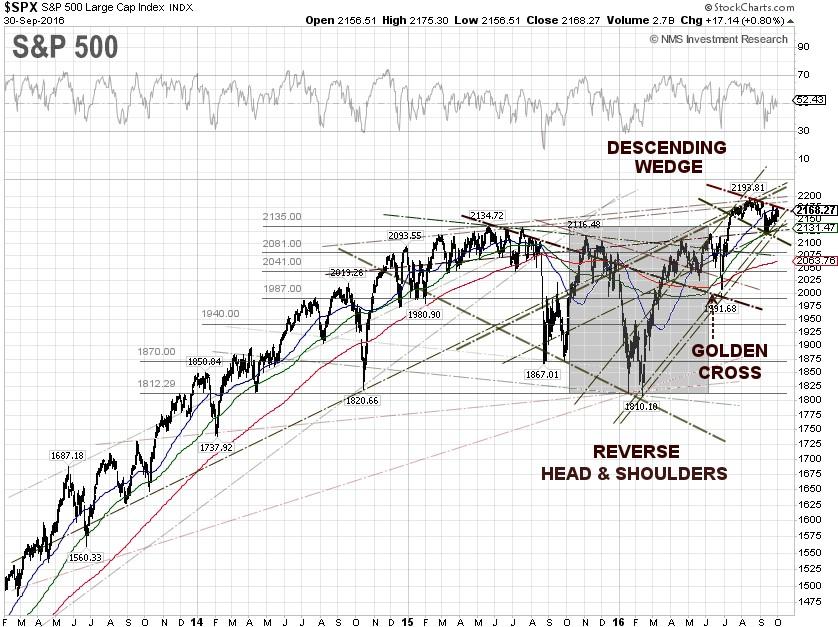
The S&P 500 managed to gain 0.17% for the week, to close on Friday at 2168.27, despite that the global financial markets were rattled by Deutsche Bank (DB) woes and multiple downgrades of the U.S. economy by Federal Reserve banks. Frankfurt-based Deutsche Bank has been in trouble since the third-quarter 2015, when the bank posted surprise massive losses in its investment banking business and is now facing the prospect of a $14 billion fine from the U.S. Justice Department for its role in underwriting and issuing risky residential-mortgage-backed securities from 2005 to 2007.
The global markets were antsy this week when German Chancellor Angela Merkel told Deutsche Bank CEO John Cryan that she wouldn't offer political assistance to the bank in the issue with the U.S. Justice Department and a bailout of Deutsche Bank by the German government won't happen either. To make matters worse, the bank's hedge fund clients began withdrawing excess cash and moved part of their listed derivatives holdings to other firms.
The U.S. economy continues to show signs of a significant slowdown, despite the Commerce Department saying on Thursday that U.S. economic growth was less sluggish than previously thought, but income ticked down. The Commerce Department revised the U.S. second-quarter GDP 2016 in its third estimate to 1.4%, from 1.1% previously, but took down the real gross domestic income (GDI), used by the Federal Reserve to gauge economic activity based on income to negative 0.2%, from 0.2% previously.
Weak economic data prompted the Federal Reserve Bank of Atlanta to revise its third-quarter 2016 GDP forecast sharply downward, twice during the week for a total of 50 basis points, to 2.4% from the previous 2.9%. The Atlanta Fed cited a mixed durable goods report, released by the U.S. Census Bureau, showing orders were flat in August and weak consumer spending, that fell 0.1%, according to the U.S. Bureau of Economic Analysis, or BEA, personal income and outlays report for August. Consumer spending accounts for more than two-thirds of U.S. economic activity. The core U.S. personal consumption expenditure, or PCE, price index rose 1.69% in August, with a 3-month moving average of 1.63%, but remains below the Fed's 2% target rate.
The Atlanta Fed has now reduced its forecast of third-quarter real equipment investment growth from 1.5% to 0.8%, and real investment residential growth from -7.6% to -8.9%, while its forecast of third-quarter real consumer spending growth declined from 3.0% to 2.7%.
Separately, the Federal Reserve Bank of New York knocked 10 basis points off its third-quarter 2016 GDP forecast on Friday, to 2.2% from 2.3% previously, while it kept the fourth-quarter 2016 GDP forecast at 1.2%, citing negative readings of real personal consumption expenditures and single family home sales. Taking the latest New York Fed forecast into account, the pace of U.S. GDP annual growth will be just 1.4% year-on-year, the slowest growth since the end of the deep recession in 2009. The current blue chip consensus U.S. GDP 2016 forecast is 1.8%.
For the week, the U.S. dollar index was unchanged, to close at 95.385 on Friday. The yield of 10-year U.S. Treasury Notes declined 1.23% for the week to close at 1.6%, while the yield spread between the 10-year and 2-year U.S. Treasury Notes stands at 0.83 percentage points, a level not seen since late 2007. The global bond markets are rattled, as the 10-year JGB yield tumbled over 60% to negative 0.079% at the close on Friday, while the 10-year German bund yield printed at negative 0.122%.
The WTI crude price surged 8.45% for the week to close at $48.24 per barrel, while the Brent crude spot price jumped 7.52% to close at $50.05 per barrel, after Reuters reported on Wednesday from Algeria that OPEC agreed to reduce its output to a range of 32.5-33.0 million barrels per day, or bpd, from the current output at 33.24 million bpd, or a decrease of about 700,000 bpd.
There are few details available as to how much each OPEC member will produce until the next formal meeting in Vienna on November 30, when an invitation to join the cuts could also be extended to non-OPEC countries such as Russia. Some analysts believe that the actual cut would be much smaller, potentially less than 500,000 bpd.
According to CNBC, the OPEC deal to cut oil production may provide a short-term support for prices, but chances are it won't change the supply outlook much, said Goldman Sachs in a research note to investors. "If this proposed cut is strictly enforced and supports prices, we would expect it to prove self-defeating medium term with a large drilling response around the world," Goldman's analysts said. The investment bank was sticking with its forecasts of $43 a barrel for WTI crude at the end of this year, and $53 a barrel in 2017.
The EIA weekly U.S. oil inventory report on Wednesday showed another decrease of 1.96 million barrels to 502.7 million barrels, excluding the Strategic Petroleum Reserve, in the week ending September 23, compared to S&P Global Platts analysts' expectations for a rise of 3.2 million barrels. The American Petroleum Institute, or API, inventory data on Tuesday showed a U.S. crude inventory decrease of 752,000 barrels.
Separately, the EIA said the weekly U.S. crude oil production decreased by 15,000 bpd for the week ending September 23, 2016, to 8.497 million bpd. Weekly U.S. crude oil output has fallen about 11.58% from the peak level of 9.61 million bpd during the week ending June 5, 2015. Houston-based oilfield services company Baker Hughes Inc. said on Friday that the U.S. oil rig count rose by 7 to 425, compared to 316, when the rig count hit the low on June 6, 2016.
The best performing S&P 500 sectors for the week were Energy and Industrials up 4.64% and 1.02%, respectively. The worst performing sectors for the week were Utilities and Real Estate down 3.85% and 1.83%, respectively.
S&P 500 Summary: +6.08% YTD as of 09/30/16
Barclay Hedge Fund Index: +4.00% YTD
Outperforming Sectors: Energy +16.04% YTD, Telecommunication services +13.79% YTD, Utilities +13.09% YTD, Information technology +11.12% YTD, Materials +9.59% YTD, and Industrials +8.92% YTD.
Underperforming Sectors: Consumer staples +5.42% YTD, Consumer discretionary +2.41% YTD, Healthcare +0.07% YTD, Financials -0.30% YTD, and Real Estate -1.83% YTD.