As the market moved to new highs today it occurred to me that we were moving very close to the upper limit of my call for the years high. The following is an excerpt from my 2013 forecast 3 part series:
In part 1 of this series I made mention of the risk/reward in holding stocks for the all time highs. My best case scenario for 2013 is a range basis the S&P of 1600 on the high side and 1260 - the 2012 lows - as the low side.
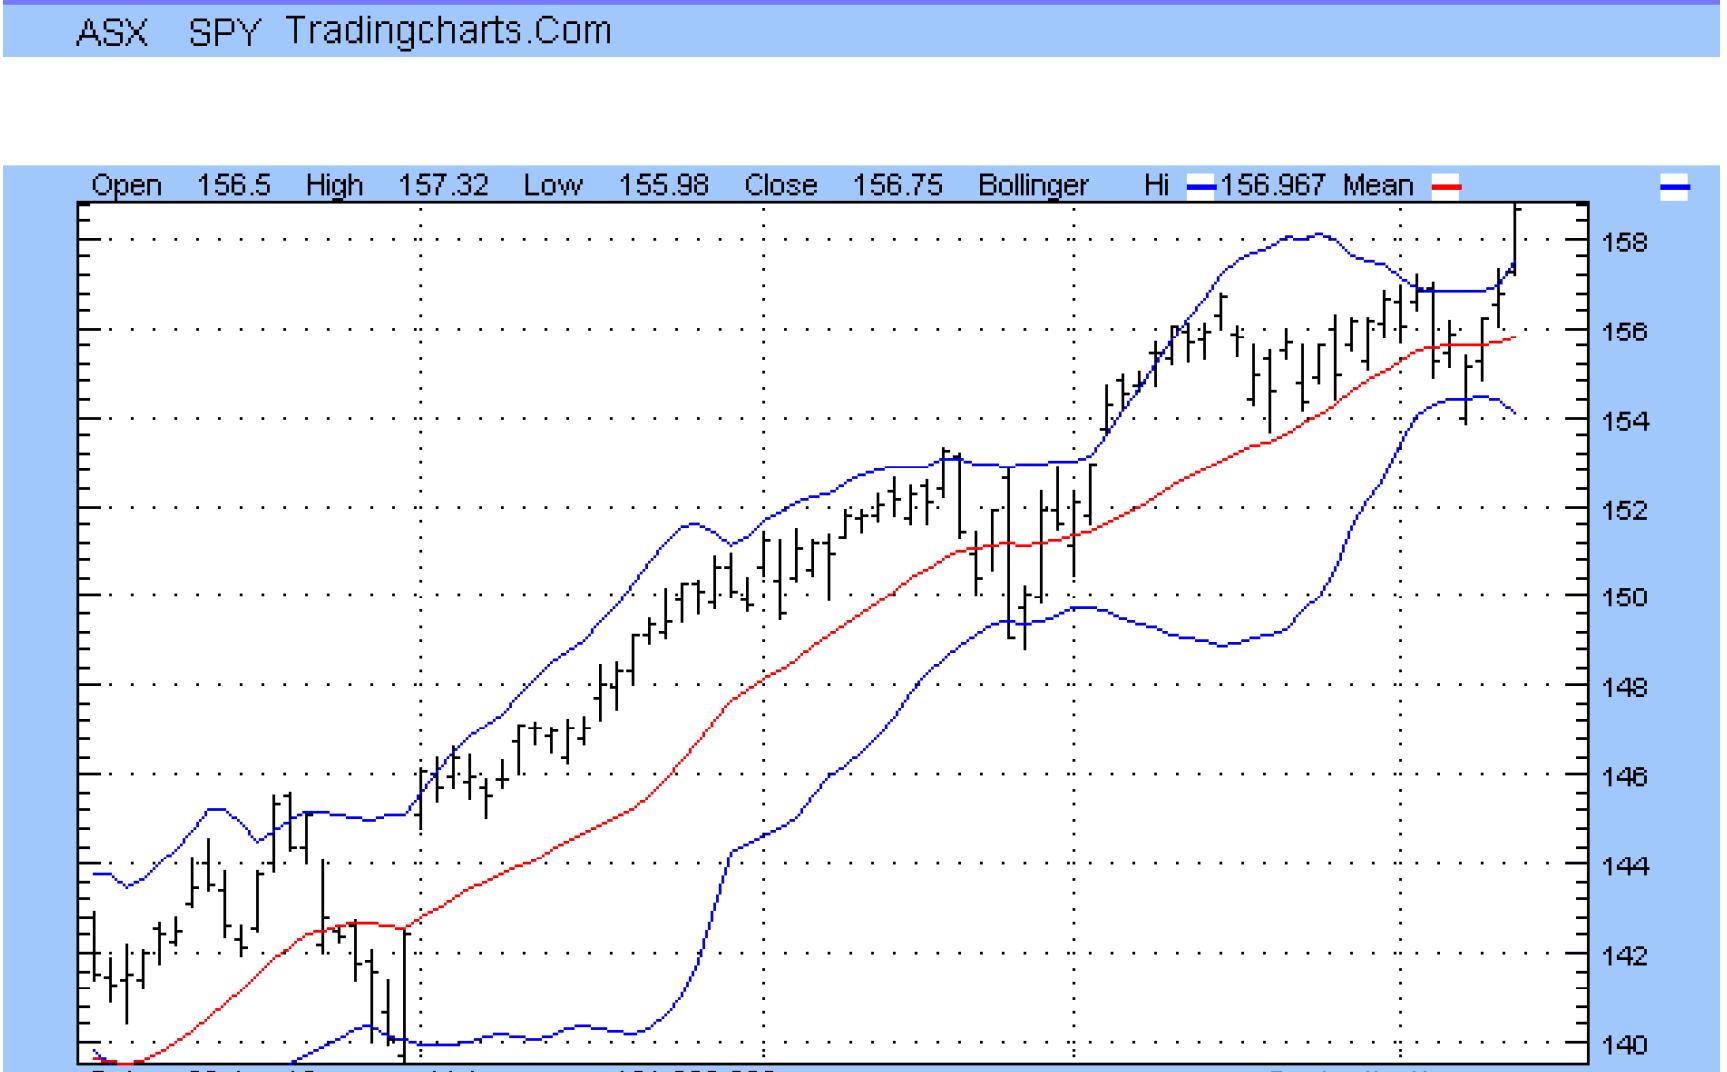
We have made a pretty good run to the upside and we have reached a point where we can now say the market is truly overbought. A look at the S&P (SPY) chart below with Bollinger Bands included shows that today's move pushed well above the upper band at 156.97.
Another tool that I have great faith in is my trade structure chart. I create the chart by plotting the close against a grid work that sets pivot points at the mean and 1 and 2 standard deviations above and below the mean. The chart below is the 90 day mean version:
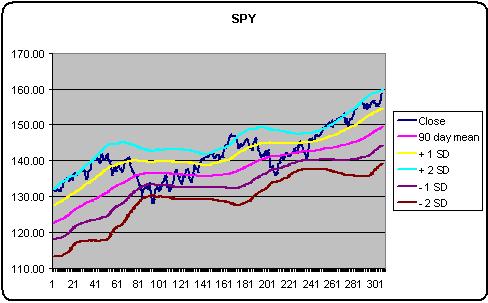
The +2 standard deviation consistently contains the closing price. The current value for the +2 standard deviation is 159.62. The +3 standard deviation value --not reflected on the chart -- is 164.73.
As you can see from looking at the chart the markets tend to move back and forth from the +2 standard deviation to the -2 standard deviation levels. The chart dates back to January 20, 2012 and the market moved from top to bottom 2 ½ times in the last 15 months.
The next chart is the 30 day mean version reflected below. You will notice that the bands are much closer and the mean value has a steeper slope. The +2 SD band on the 30 day is 158.48 and the +3 SD band is 160.30.
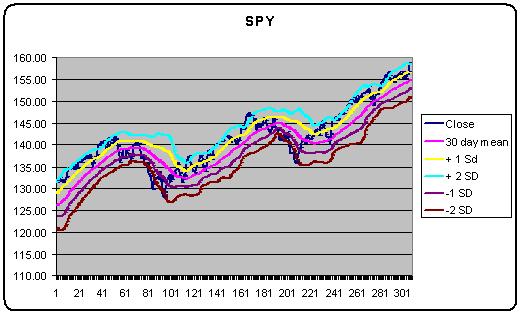
The -2 SD is 139.17 and 151.13 respectively for the 90 day and the 30 day mean. The fact that the +2 SD on both charts is within a few points of each other is significant and usually provides confirmation that we are at a top.
As you can see from the charts above the close is consistently contained within the +/- 2 SD bands. There is nothing that precludes the close hugging the upper band as the mean value -- a moving average - moves steadily higher as it has done for most of the year but the fact that we have moved substantially above the upper Bollinger Band and the fact that the market is beginning to have a broader range than earlier in the year suggests that we are in fact not going much higher.
The charts above suggest that we are very close to putting in a high. What would confirm the high in my mind would be a gap higher on the open tomorrow morning that begins to sell off in the first hour on heavy volume. Even more compelling would be a sell off that takes out today's low of 157.13.
I generally argue that it is almost impossible to call a high in a bull market but the probability of doing so is greatly enhanced with the tools I am using here. The point I am making is that at these levels the odds of being right are much greater than trying to call a high when the market is trading at the mean value.
The probability of the market moving much higher than 2 standard deviations is about 95% against that occurring. It does happen on occasion but it is very rare. Additionally, for the market to move further above the upper Bollinger Band than today's close is also not likely. One thing for sure - we won't have more than a day or two to see if this call is a good one.