Appraisal as per a strict application of the "Rhea/Classical Dow Theory"
We know that the trend determined by Schannep's Dow Theory is bearish (signal of November 2, as explained here).
We also know that the trend according to the "Rhea/Classical" Dow Theory as interpreted by Schannep is bullish (signal of 9/7/2016), as was explained here.
Yes: It is possible for different Dow Theory "flavors" (Rhea and Schannep's) to diverge. At critical junctures (changes of trend) this may happen as one Dow Theory variation may be reacting earlier than the other. Furthermore, the current ranging environment favors contradictory signals depending on the Dow Theory "flavor" applied, as no clear and clean trend is able to emerge. Under such a hesitant market, is it perfectly possible to have contradictory readings, as, i.e. slightly changing the time requirement for a secondary reaction will result in totally different readings. This is due precisely to the lack of clear trends. If there were a strong trend, irrespective of measuring secondary reactions with two or three weeks or utilizing 2 indices (classical Dow Theory) or 3 indices (Schannep's) we would have identical readings. In most instances Schannep's would be somewhat earlier at signaling the new trend but the Rhea/Classical Dow Theory would follow suit.
Thus, the fact that we can derive so many divergent trends depending on the way we apply the Dow Theory is a warning as to the very unusual situation we are currently living. Something similar is happening with moving averages. If were is a clear trend, the gauging thereof would not be particularly parameter sensitive. In other words, irrespective of the use of 200, 150 or 230 days as lookback period, the trend is going to be bullish. However, when markets range, prices tend to cluster around the very same moving average, and hence slight variation of the parameters may result in different trend readings.Something similar happens to the Dow Theory, albeit, as I have explained before, it is much less prone to whipsaws than moving averages, and hence avoids overtrading.
Thus, those being tempted to lambast the Dow Theory (of any flavor whatsoever) as unreliable because I am displaying several alternative readings, should rather stop, think, and see that noise is overwhelming the signal.
Today, I am going to analyze the US stock market under a strict "Rhea/Classical" Dow Theory prism. This implies using only two indices (the Industrials and Transports), and more critically, demanding three weeks of the appraisal of a secondary reaction.
The starting point is the primary bear market which was signaled on June 24th, 2016. Here you have the chart:
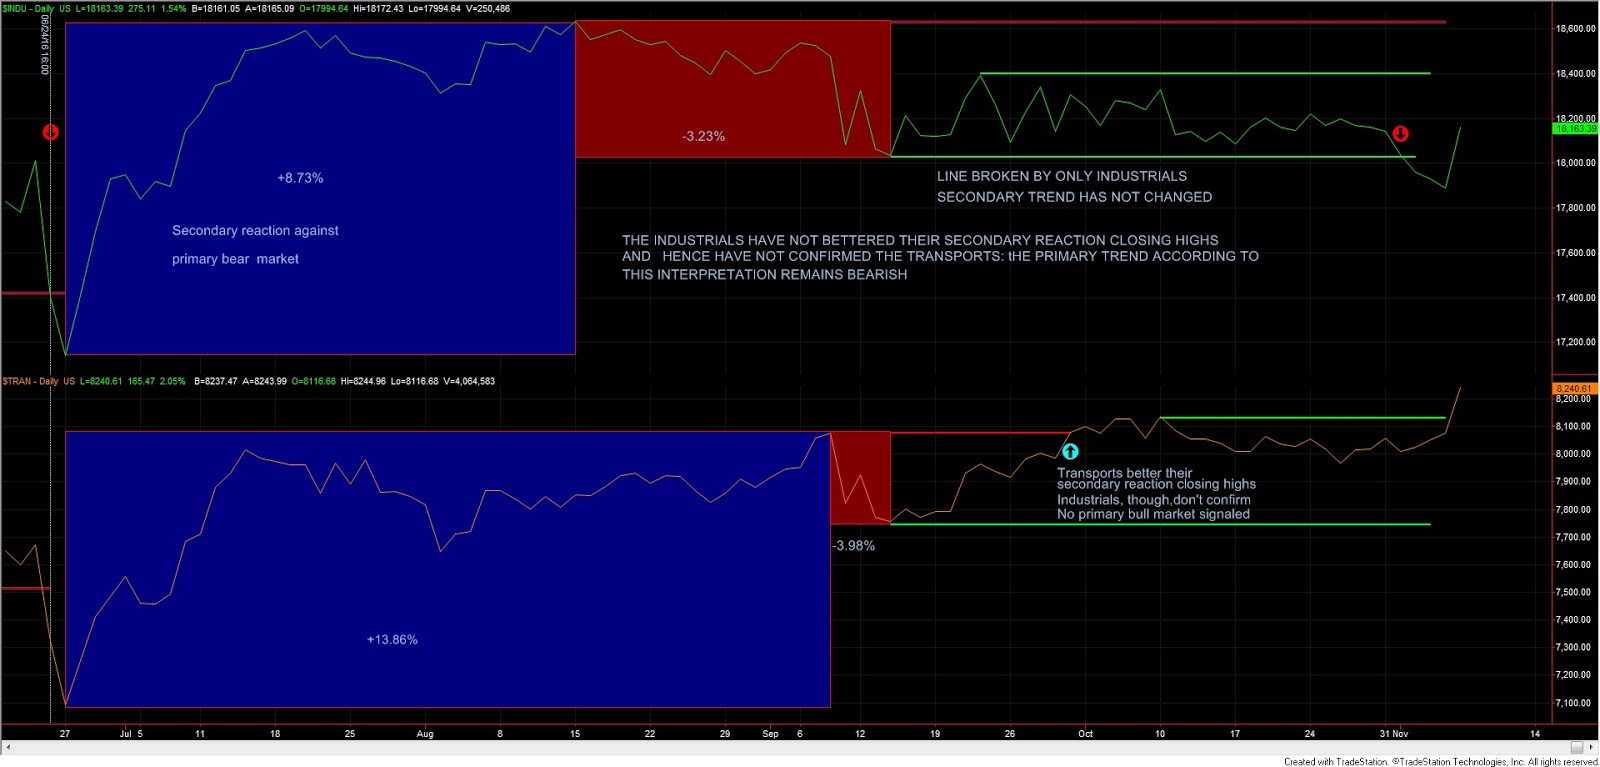 |
| Another possible interpretation of the classical Dow Theory: if we require three weeks for a secondary reaction to exist, the primary trend remains bearish |
Even under the most stringent classical/Rhea interpretation, it is beyond dispute, that the blue rectangles display a secondary (bullish) reaction against the primary bear market. The Industrials rallied from 6/27/2016 to 8/15/2016 (that is much more than 3 weeks) and the Transports rallied from 6/27/2016 to 9/8/2016 (again much more than 3 weeks). The upswing was for both indices much more than 3% (+8.73% for the Industrials and +13.86% for the Transports). Following the highs of the secondary reaction both indices declined more than 3% (strictly with just one suffices, as explained here). On 9/30/2016 the Transports broke up the secondary reaction closing highs. However, the Industrials is far from confirming, and hence, absent confirmation, no primary bull market has been signaled, if we are to judge the trend exclusively based on the breakout of the secondary reaction highs.
Thus, according to this interpretation the primary trend for stocks as per the Rhea/Classical Dow Theory remains bearish. The secondary trend is bullish (secondary reaction against the primary bear market).
Therefore, if we demand at least three confirmed weeks of ascending prices for the secondary reaction to exits, the market remains under the grip of the bear.
Please mind that a "line" has developed (green horizontal lines), which Rhea defined as a "price movement extending two to three weeks or longer, during which period the price variation of both averages move within a range of approximately 5%". The "line" has been violated by the Industrials. However, the Transports have refused to confirm. Conversely, as I am writing those lines (some 1 1/2 hours after de open of Nov 7th), the Transports seem breaking up above the line closing highs, unconfirmed by the Industrials. Hence, neither the breakup nor the breakdown has being confirmed. Therefore, no change of the secondary trend has been effected by the line, which means that according to this interpretation of the Dow Theory, the primary trend is bearish (signal of 6/24/2016) and the secondary trend is bullish (secondary reaction against the primary bear market). More about lines, their importance when applying the classical Dow Theory here.
In the next post of this "trend determination" saga, I will analyse the US market under another rule that is found in the "Rhea/Classical" Dow Theory, Such a rule is frequently overlooked by many practitioners (not by all, as we will see) and it is, though, vital when other rules (i.e. trends based on the breakup of secondary reactions) fail due, precisely to the difficulties of gauging secondary reactions due to poor market conditions. In my opinion, such a interpretation is the one that definitely settles the true nature of the primary trend, as we will see, even though the two interpretations hitherto studied have merit on their own.
Sincerely,
The Dow Theorist