Sunday 7 October 2012
Gold and silver remain just under important resistance. The question with which we get to deal now is, are we seeing a pause before breaking above resistance, or will there be one more reaction lower prior to resistance giving way? We lean to both markets going higher as an inevitable event because history remains on the side of massive failure of all central planner's attempts to control markets, and this is also at a time of presidential elections where lies about the economy are spewed daily by the incumbent and the demonstrably inept administration-driven federal reserve. It is just a matter of time.
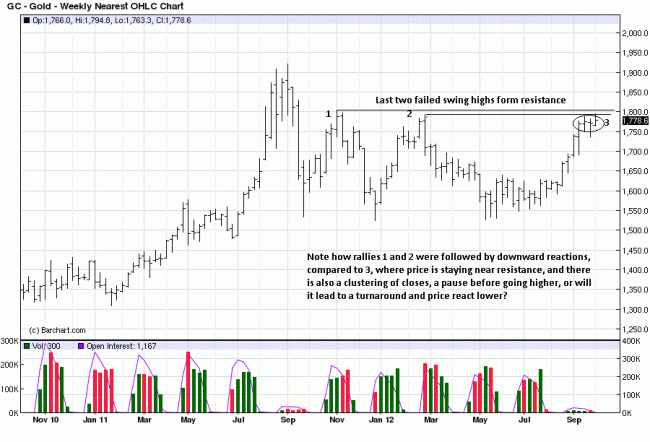
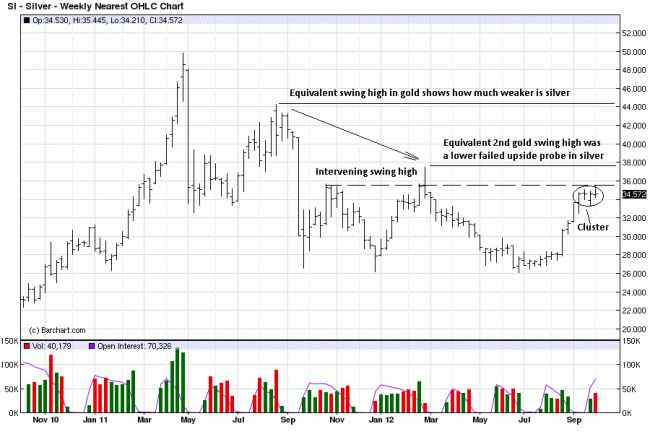
We often remark that HOW price behaves at/near resistance or support is important. The weekly chart, at previous swing highs 1 and 2, shows price reacting lower from the 1800 area. At the current swing high, price is "hanging around" resistance and not moving lower. The clustering of closes is either a resting spell for the current rally, or it is possibly a turning point for another correction.
Which is it, and do the lower time frames help answer the dilemma?
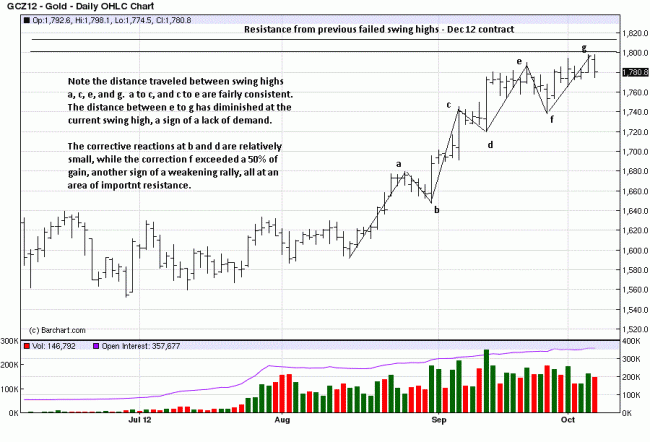
The swing highs and ensuing reactions have been labeled on the daily chart. There is no question that the rally has weakened at resistance. The reaction at "f" is where a second long position was taken at
1753. The rally since has been stalling, and there is a cluster of closes over the past seven trading days. Except for the low close at "f," one could say the clustering extends back to the middle of September.
For the short term, this can go either way. While there has been no evidence of supply coming into the market, Friday was a weak close. Does it portend a lower week ahead? [We are sticking with the trend
until proven otherwise.]
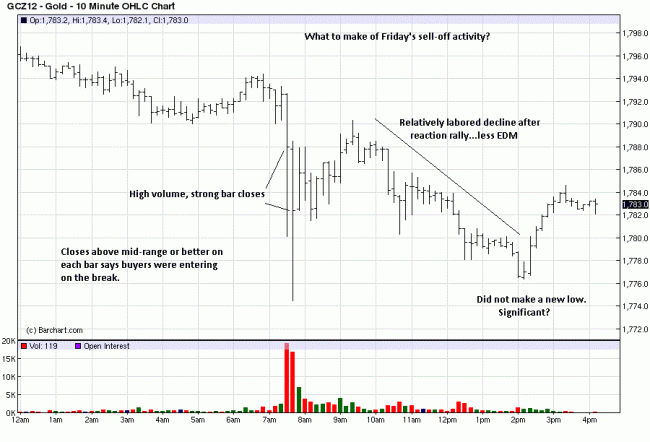
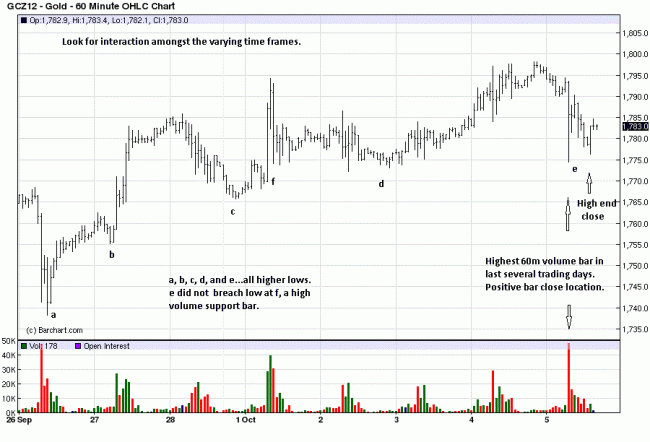
Intra day, on Friday, the sharpest volume increase in days occurred in an early decline, but notice the position of the closes on the two widest range bars down. The closes were above mid-range each bar,
and this tells us that buyers were taking all that was being offered from sellers. After a rally back to intra day resistance, where 1790 support was broken, price reacted lower again, but in a much more labored fashion, and the early low held.
Meaningful? Hard to say, at this point. We are still sticking with the trend, weaker though it has become.
Intra day volume is important only for the last several trading sessions that are more germane to the shorter time frame, so we looked at a 60 minute chart to see if a different picture emerged than the 10 minute chart.
One should always pay attention to spikes in volume because they are important pieces of information. Sharp volume increases most always denote a change in hands between weak and strong holders. Even with the spike down volume on Friday, the series of higher lows remains intact. This begs the obvious question, why didn't the huge volume increase do more downside damage?
The last volume spike, at "f," shows a strong rally developed, and when a strong rally develops as a result of strong volume, that area trends to be defended. The higher volume on Friday did not violate
the lows of the high volume rally of 1 October. Why not? [So far, a successful defense from those buyers.]
All we are doing is observing the market activity spread over varying time frames to see if clarity can be had. We present both sides: an established trend at resistance, and a show of weakening of demand.
The reason why we say we are sticking with the trend is because it is where proven strength is. Things can change on Monday, but until things change, we have to go with what is.
Whether the trend continues or undergoes some kind of reaction lower will only be known in hindsight, from here. So we stay with what is known and wait for confirmation in the form of continuation or a
correction. If the latter, we have stops in place above the last purchase area that will leave room for a profit, barring a fast market through the stops.
One other observation to make, which are all fact-based as they exist on the charts, is how the wide range bars on increased volume closed on the upper range of the bar, a sign that buyers were in control for that time frame. If it were supply [sellers] entering the market, the closes would be weak and on the lower end of the bar[s].
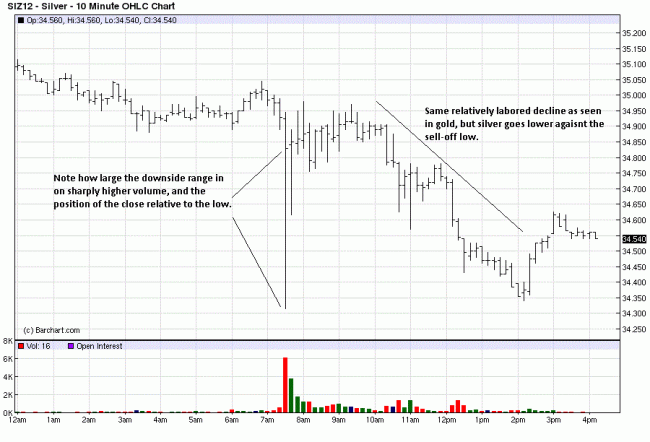
There is little difference in silver, except to say it is relatively weaker than gold. Go back to the weekly gold chart and see how close are the last two failed swing highs, and note the difference in the same
failed swing highs for silver, date-wise. The difference in the second lower swing high in silver is dramatic, and it clearly shows the relative weakness. There was an intervening swing high in silver that is indicated by the broken horizontal line, and it now acts as resistance. The same clustering of closes is evident.
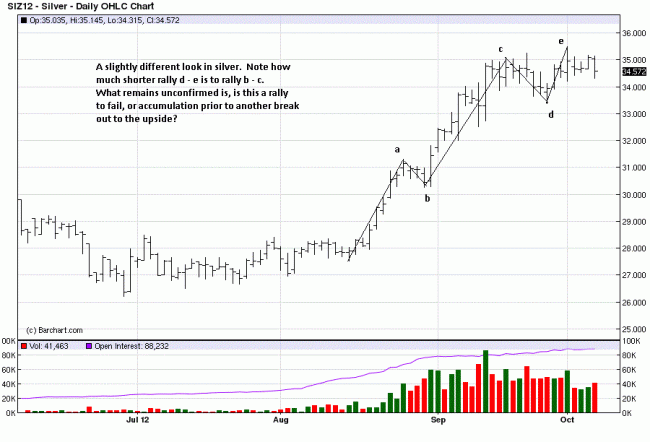
If you compare the distance traveled by the two swings, d to e, relative to b to c, the last swing high has weakened considerably, at resistance. The trend remains intact, and the long position taken when the reaction at "f" occurred, 33.99, is also protected with a stop above entry, should price continue to react lower.
We are not treating the second position any differently than the first one, long from 30.60 on 24 August. Let the market run until stopped out. We readily accept if both recent positions are stopped out, for we will have followed established rules for trading, and would then simply wait for the next opportunity to develop. Consistency is key, and following trading rules is more important than the resulting profit or loss.
The only notable difference between gold and silver on the 10 minute intra day chart is how much silver closed nearer the high of the intra day sell-off bar. The importance of any close is that it tells us who won the battle between buyers and sellers. It looks like buyers overwhelmed efforts from the sellers to close that period on sharply increased volume at the high.
We remain long gold at 1659 and 1753; silver at 30.60 and 33.99 until stopped out.