Yahoo has Stockmarket data for the Australian All Ordinaries since 1984. I have used that data to compare stock market recoveries from market bottoms since the deep, short, dramatic crash of 1987.
Background
On fundamentals Australia did not have a housing collapse or oversupply, had no or a very short shallow recession, has little in the way of unprovisioned bank credit losses and has relatively small unemployment, largely due to stimulus which flowed to the firms and workers in the construction industry. There is high private debt to GDP, but extremely low Government debt to GDP. The deficit is moderate compared to developed other countries. Australia issues its own currency. Some say Australia still has a housing bubble. In 2009 Australia had one of the best performing stock markets in the world in both USD and EUR terms.
Where we are - 310 of 350 days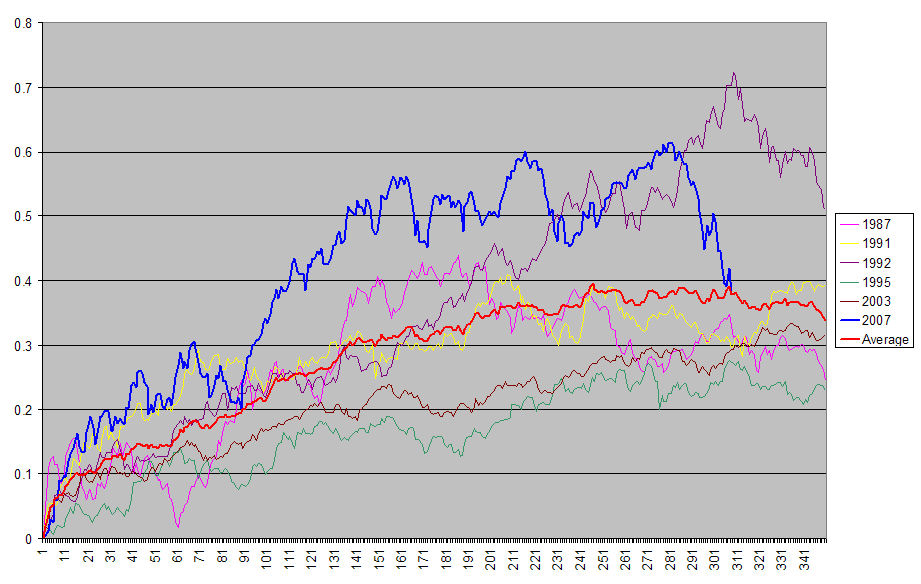
The current (bright blue) recovery was much faster for 160 days but is now back to average (bright orange) values. Only the recovery from 2003 was higher after 310 days, so this recovery is still ahead of 4 out of 5 other recoveries.
Where we are going - looking to 1200 days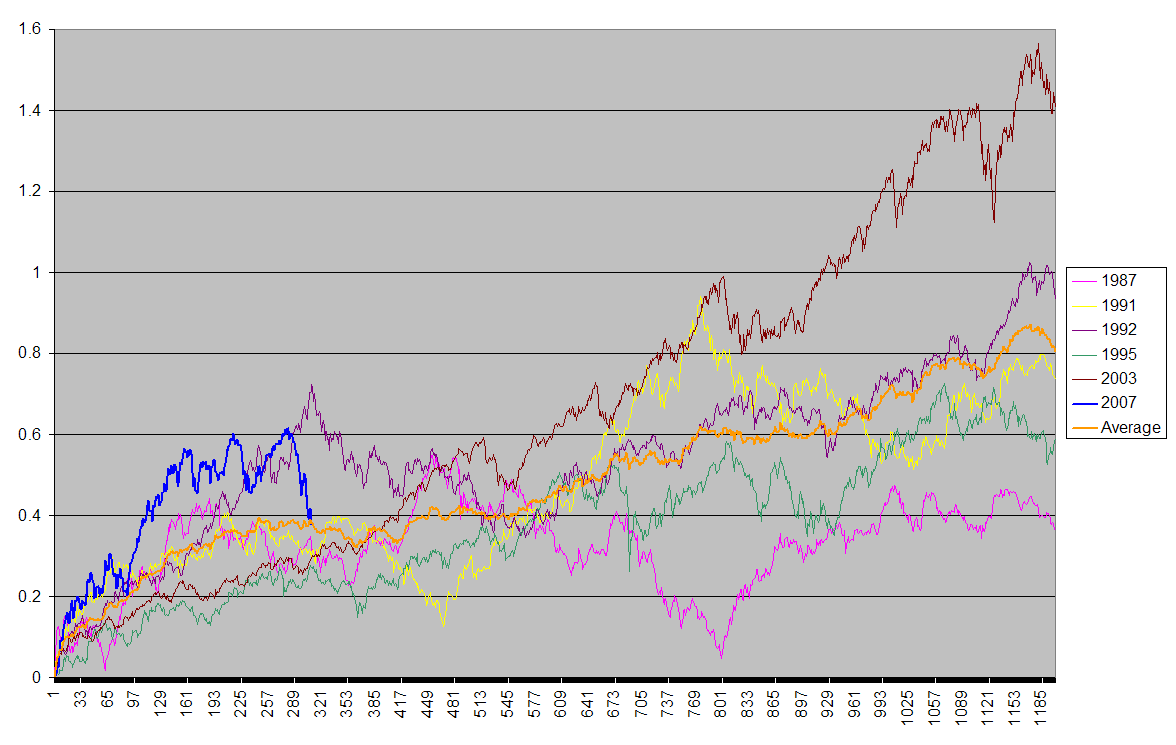
The Average recovery falls away from day 310 and does not recover to current levels until about day 450. The Average recovery does not break up from +40% until about day 560. The average balances the 1987 recovery which fell back to only +4.6% at day 800 against the 2003 and 1991 recoveries which each reached +94% at day 780.
Other than 2003, all recoveries shown went to a significantly lower point by between day 350 and day 460.
In addition to 1987 major bottom at day 800 (described above):
* 1987 also double dipped from +44% at day 186 to +24% at day 354
* 1991 also "double dipped" from +40% at day 210 to only +13% at day 468
* 1992 also double dipped from +71% at day 310 (same as where we are now) to +35 at day 529
* 1995 had a correction from +26% at day 273 to +15% at day 364
2003 eventually had a small correction from +58 at day 515 to plus +47 at day 554.
The outlook for period out another 200 days to day 510 is for a risk of a major (new or continuing) correction in the Australian broad indices.
Acknowledgements:
Doug Short for his similar charts on the US market
John Hussman for his current newsletter about Aunt Minnie and the risks to the market in the near to meduim term.
iShares MSCI (NYSE:EWA), IQ Australia (NYSE:KROO)
Disclosure: Multi national bond fund abou7 80%, mix of share funds about 20%; 80% AUD, 20% other currency denominated.
Comparison of Australian Stockmarket Recoveries since 1984
Seeking Alpha's Disclosure: Past performance is no guarantee of future results. No recommendation or advice is being given as to whether any investment is suitable for a particular investor. Any views or opinions expressed above may not reflect those of Seeking Alpha as a whole. Seeking Alpha is not a licensed securities dealer, broker or US investment adviser or investment bank. Our analysts are third party authors that include both professional investors and individual investors who may not be licensed or certified by any institute or regulatory body.