The Frankenstein Fund - August 2015 Update Mid Month - The Carnage Continues, But My Income Went Up Anyway - Huh?
August 11, 2015
So, here we are in the middle of the summer doldrums. All the iDots at the Fed and their lackeys are running around mumbling about imminent liftoff and improving growth and higher employment and higher average wages and all sorts of BS. Maybe they ought to drop by Stockman's Corner or ZeroHedge to get a clue about what the rest of us see on a daily basis.. like this for instance, or maybe take a listen here.
So, enough ugly macroreality for now, here's what happened in my cave this past 2 weeks. In case you were on vacation with the inlaws watching Simpsons reruns or perhaps stuck without WiFi rereading all the same comments from the same people on SA in a nice igloo near the Antarctic or some other out of the way scenic spot where you could escape the heat, you might have noticed that the market in general and my net portfolio equity in particular (based on Market price moves as opposed to net 'rents' collected)* is reacting to all the loose talk about interest rates by swirling in a decidedly black hole pattern:

Everything is down in market value except for my Jan 2017 LNCO $10 Put position which seemed like a no brainer back in January 2015 when the stock was trading at $11-$12 or so. it's up 100%. Sigh.
So, basically with the oil price move dramatically lower and the impending suspension of the dividends coming in October the LNCO position ate my excess equity, and then my lunch, and then dessert too.. Plus the bastards took away $15,630 of my projected income for the 2015 calendar year and probably all of next years projected $66,432.00 too - but more on that later.... Like in late September or October.
So what to do. What to do..Hmmm
Here was my projected income for the month of August before rearranging:
| KBS | 8/4/2015 | $497.70 |
| LNCO | 8/16/2015 | $5,120.00 |
| LINE | 8/16/2015 | $416.80 |
| CEFL | 8/20/2015 | $12,076.00 |
| MORL | 8/20/2015 | $4,345.00 |
| SLVO | 8/26/2015 | $6,000.00 |
| CLM | 8/31/2015 | $3,680.00 |
| monthly total: | $32,135.50 |
And here is it after the rearranging and final div announcements:
| August | ||
| KBS | 8/4/2015 | $497.70 |
| LNCO | 8/16/2015 | $5,120.00 |
| LINE | 8/16/2015 | $416.80 |
| CEFL | 8/20/2015 | $12,076.00 |
| MORL | 8/20/2015 | $4,345.00 |
| SLVO | 8/26/2015 | $5,142.00 |
| CLM | 8/31/2015 | $16,560.00 |
| monthly total: | $44,157.50 |
As you can see, my August income went up about 37.4% or ~$12K. Now how did I do that with everything in the crapper?
Looking ahead at the handy dandy Dividend calendar I saw that the next payment from OXLC lands in September with an Xdate of - wait the Xdate is now 9/30 and it now pays in October? WTF? and as usual WMC pays in late October with an Xdate of 10/1.
Click, click, BOOM - gone.
Then I bought 35,000 more CLM, which had an Xdate of 8/12 and used the rest of the leftover dough to placate the margin monster & to pay off all the kitchen bills = Whoo-Hoo!
Maybe I'll actually have a 3 digit credit score again before Labor Day.
So now you know what is going on underneath the moving cups. Why might this be a good longer term move even if it was semi forced by the usual "Mother of Invention" reason?
- Well ASS-uming that CLM continues to pay about the same div of ~$0.368/month next year that it has announced for the balance of 2015, I just "added" $154,560ish of income to the yearly take,
- and it's a 30% stock, and I need more of those to balance out the 50% stocks (MORL, CEFL, BDCL) so I can maintain my 10% buffer plan,
- and it pays monthly, so it helps bring up the months in between the "big month" of all the quarterly payers,
- making the minimum baseline income per month now at least $35,000
- AND it bumps up this months income when I need some more dough anyway
Now astute readers might say "but you sold a bunch of stock!! - it's really a wash!!".
Well it might be a wash if I do not buy that other stock back before the next Xdate, and so far both are about -$1 from where they were priced when I sold them, apparently from "THE FED EFFECT", (sounds like a B monster movie right?) so I'll get them back in a few weeks at a nice discount if this keeps up.
"But where will you get the $$?"
Well since I do not have a portfolio filled with the Slacker 50's of the world (like PG etc) I will get the $44K income mentioned above over the course of the 2nd half of the month instead of $44, and since all the bills due for August have been covered already that can all go towards the OXLC repurchase, plus the $100,000 coming in from the car refi's later this month, and I've got some other things going on the background that ought to give me another $100K or so to repurchase shares with by the first week of September.
That first $139K or so will replace all the OXLC and leave some $100K or so over to start nibbling at the WMC again, which ought to take about the same $ to replace as the OXLC since both are 30% stocks. I ought to have both positions fully restored before their respective Xdates, so no hiccups to the projected YOY income flow.
Net takeaway:
The LNCO & LINE shares were PROJECTED to produce $66,432.00/year before the dividend elimination....
..but then I added ~$154,560 of new cash flow with the 2nd CLM purchase for a net "gain" after the dust settles of about $88,128/year pushing the to total to ~$850K give or take.. and hopefully Mr. Market will stop taking.
YAY!
So, the way I look at it... it's income redistribution from me to me. I like that better than the Obamanation kind.
Just +$150K in net yield to go before I stop buying so aggressively and let the div stream pay off everything. My crystal skull says "be looking to be done buying by end of Feb 2016" and when he talks I listen.

**************************************************
Thoughts From the little * above.
About those Net 'rents' collected or to borrow a clear definition from the RE space:
"Cash-on-Cash Return- This number is how much return you are getting on the money you invest. If you pay all cash for a property, (in my case a stock) this number will be the same as the Cap Rate. If you are financing, (aka using leverage or margin) this number is the most accurate way to see the actual return you are getting on your cash-in and the leverage. Here is the equation, and remember to include the mortgage payment (in my case, the margin interest) since this one is totally focused on financing:
Net Annual Income / Total Cash Invested = Cash-on-Cash Return"
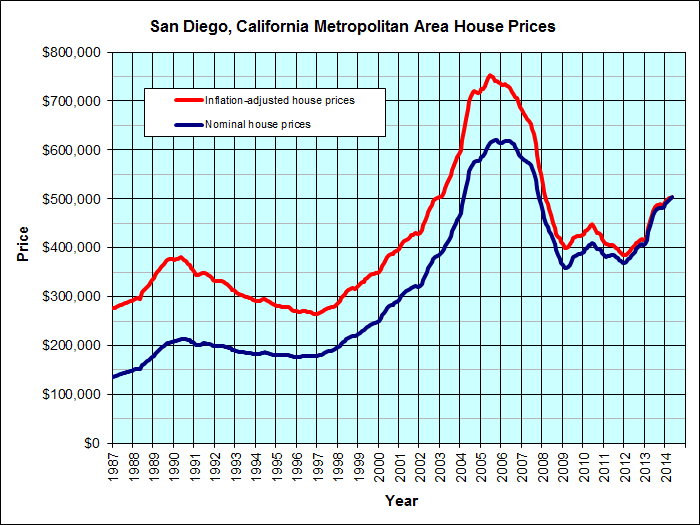
Income stocks are just like rental RE, "The Market" might value them wildly differently on different days depending on the current whim of herd mentality. That average $275,000 rental property (charted below) has been all over the place over the last 25 years in MARKET PRICE as you can see from the wiggly lines below, even hitting it's 1990 price in inflation adjusted dollars in 2012!! - but it still be payin the rent:
And what lines your pockets as an INCOME investor is the regular INCOME, not the market price. Did I mention I like INCOME?
Lets stack it!