Sometimes when looking at a standard bar or candlestick chart it can be difficult to find the support and/or resistance areas. Using a point and figure chart can simplify this task. Remember x's indicate up moves and o's represent down moves. When looking at this chart you can see that major resistance is at 1120 to 1130 and major support is around 1120.
Still no long term sell signal from my system. I hope we rally soon though because it is getting close.
CLICK ON CHART TO ENLARGE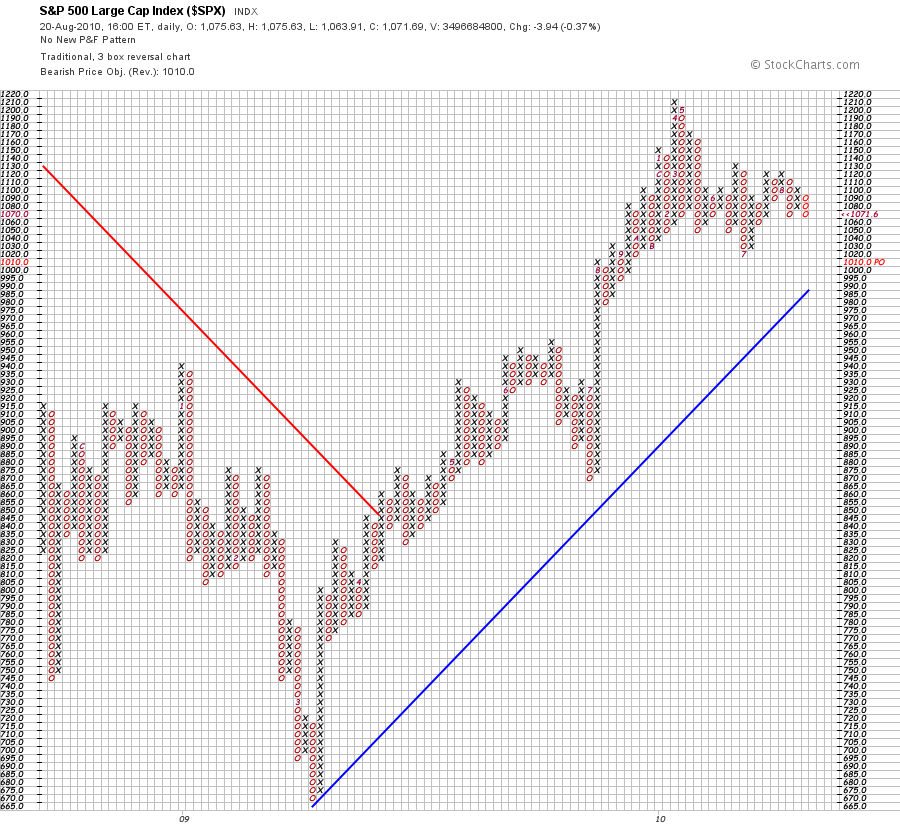
S&P 500 SUPPORT AND RESISTANCE
Seeking Alpha's Disclosure: Past performance is no guarantee of future results. No recommendation or advice is being given as to whether any investment is suitable for a particular investor. Any views or opinions expressed above may not reflect those of Seeking Alpha as a whole. Seeking Alpha is not a licensed securities dealer, broker or US investment adviser or investment bank. Our analysts are third party authors that include both professional investors and individual investors who may not be licensed or certified by any institute or regulatory body.