 The broader markets have risen appreciably since reaching their respective lows on October 15th. Basis the futures the DJIA (YM) has climbed 1586 points or 9.2%, the SPX (ES) 206.25 points or 10%, and the NDX (NQ) 489.75 points or 11.5%. The moves themselves were made within 12 trading days with the DJIA and SPX producing new all time highs while the NDX moved to an additional new 14 year high. Astonishing feats of seemingly unprecedented proportions, well maybe.
I came across an interesting report first published on www.zerohedge.com, which caught my attention. Mostly because I live in San Francisco and have witnessed first hand the incredible parabolic rise in real estate prices as well as rents. The Case-Shiller report tracks the year over year price increase of San Francisco real estate. The headline "This Has Never Happened Before Without A Massive Bubble Bursting" demands attention the following chart is a wake up call for all of us.
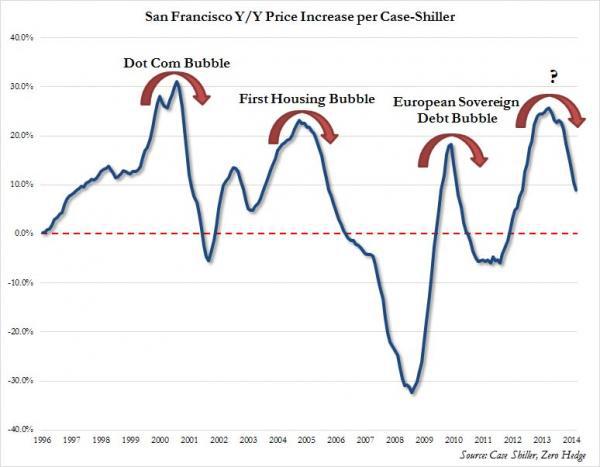
In June of 2014 the Case-Shiller index had crested at 25% and was headed lower dropping to 19%. The above chart shows the Case-Shiller index dropping more precipitously with the annual price increase in San Francisco putting double-digit percent appreciation territory in the rear-view mirror, and has slide back into the single digits, or 9% year over year. At the current rate with all else equal, San Francisco home prices will move back into negative territory in another 5-6 months and when taken in context would only be the fourth time they have done so in the past twenty years. Check out the chart again - there has never been a time when the all important leading indicator, which is the San Francisco housing market, has posted such a steep slowdown in annual price increases without a bubble of some sort bursting.
What makes San Francisco's housing market so important? It's location. San Francisco has benefited strongly from the general Fed-driven liquidity bubble, but also from its proximity to both Silicon Valley and China, so it also benefits from two other liquidity bubbles - that of cash rich technology and the Chinese $25 trillion financial debt beast. Since the local housing market began to crumble in China, the local oligarchs have little choice but to put massive amounts of cash abroad and what better city to benefit from that inflow of capital but San Francisco.
So has the global central bank coordinated credit bubble burst? Taking a look at the equity markets and the San Francisco housing market, almost but not yet. But it appears that the wealthiest home buyers, a reliable leading indicator of easy financial conditions, are quietly sticking for sale signs on their mansions and opting to "downsize".
I have updated my Elliott Wave count for the Nasdaq 100 and include the updated chart below:
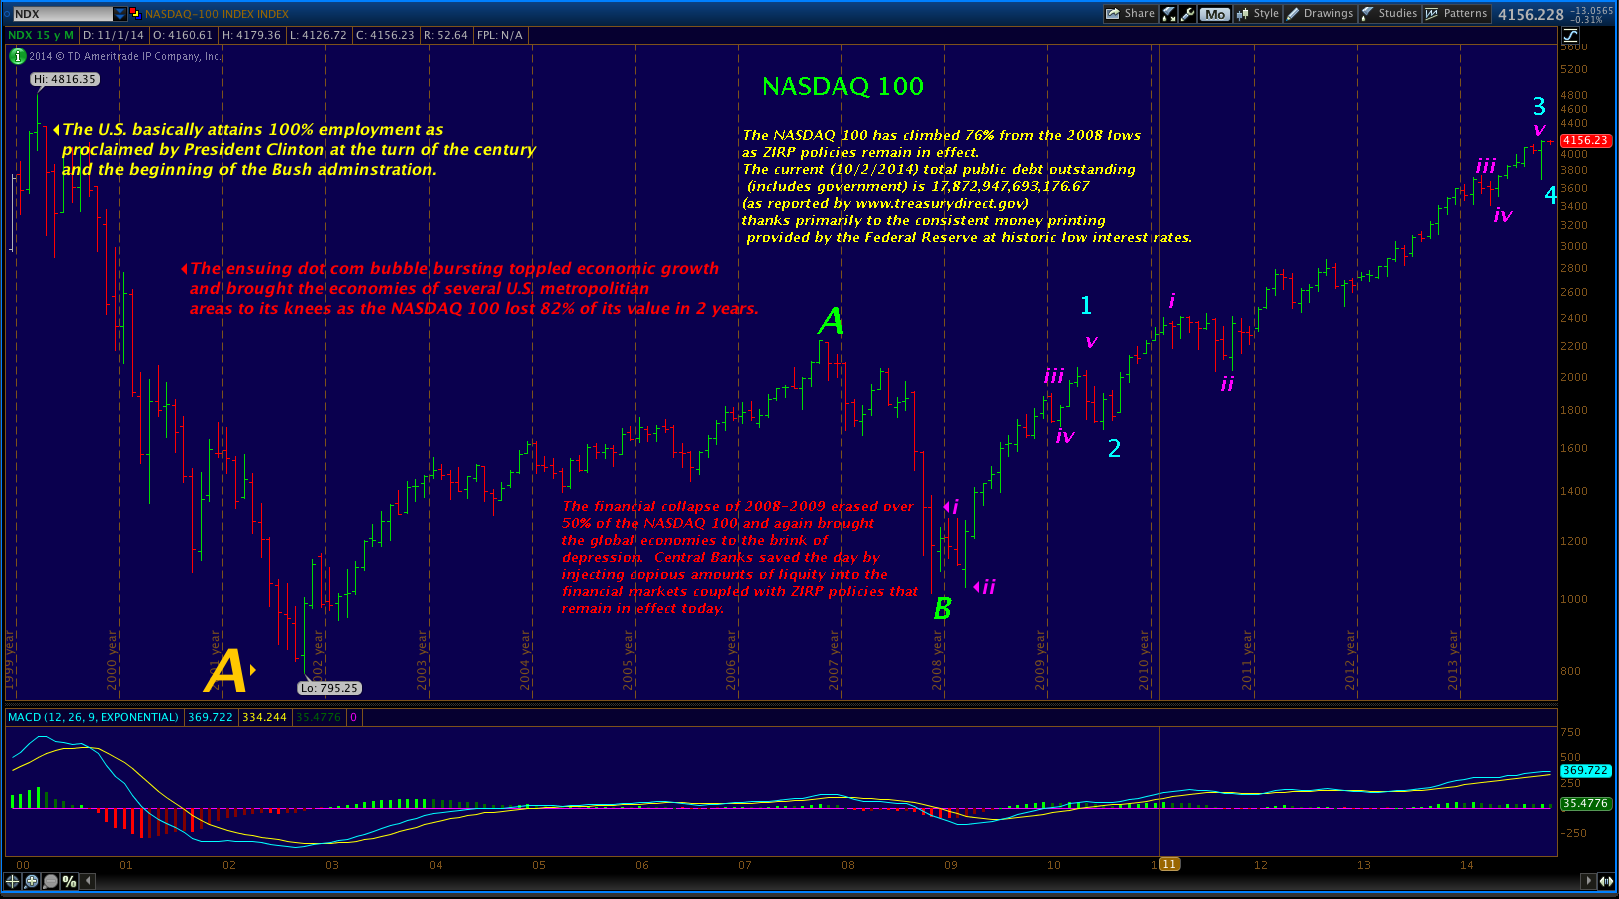
The NDX has been in the process of tracing out a Super Cycle B wave off of the 2001 lows, a move that has been 13 years in the making. Thus far Cycle Waves A and B are complete with Cycle wave C underway off of the 2008 lows. Within wave C it appears that waves 1-4 (out of 5) are complete. The most common relationships between waves 1 and 5 within a 5-wave sequence are: wave 5 = wave 1, wave 5 = .618 (wave 1), and wave 5 = 1.618(wave 1).
Here are the numbers:
- Wave 1 of C = 1040.56 points
- .618% of wave 1 = 643 points
- 618% of wave 1 = 1683.63 points
We now can put some parameters around the potential finishing points for the current advance in the NASDAQ 100. Wave 5 of C would be equal in length to wave 1 of C at 4740.80. Wave 5 of C would equal .618(wave 1) at 4343.25. Wave 5 of C would equal 1.618 (wave 1) at 5383.85.
The NDX has already pushed to new highs for the current rally reaching 4179.90 on October 31st. That equates to approximately 40 to 76% of the expected move based on the calculations shown above. The Case-Shiller index suggests a window of approximately 5 to 6 months before the index drops into negative territory. That would suggest March to April 2015 as being the most likely window for an equity market top. Interest rates are currently being projecting a hike from March to June 2015. I suspect the NASDAQ 100 will complete Super Cycle Wave B sometime within the first to second quarter of 2015 as the next bubble bursts.
 Remember the key is being able to reduce and separate the "noise" from opportunity. This takes knowing and executing a well-defined strategy and allows you to see opportunities amongst the "chaos" and by trusting the mechanics of your strategy, be able to take advantage of them.
Opportunity continues to knock on our doors. While it doesn't come without risk, risk can be defined and more manageable. Volatility and broad moves are exactly what a day trader desires and being able to respond without questioning is a luxury many are unaware of.
 The Logical Signals Trade Room is up and running. We have an outstanding group of members that have already begun contributing across the board from trading indicators, patterns and products, to computer software and hardware.
Thus we are ready to move on to phase two of membership/subscriptions. Now that a core group has been established we have a few additional spots for other traders that may have an interest. Phase two, though will be somewhat more involved in that prospective members will get a chance to talk in more detail on their trading goals, experiences and expectations with me and possibly other members before deciding to join. At this early stage it is important to continue to steer the room in a direction that favors all of the members. Should you have an interest please contact me at Michael@logicalsignals.com I should have the updated "Invitation to My Trade Room" under the Trade Room tab back in place soon. Presently we have 10 additional spots open before closing this room until next year.
Steer the course and don't compare yourself to everyone else. You are not they and they are not you. Remember to trust and believe what makes you unique at this moment in time and in this situation and allow others to choose for themselves. Don't be swallowed up by the chaos and false emotions swirling around. Remember it's just a number.