Long Term Trend
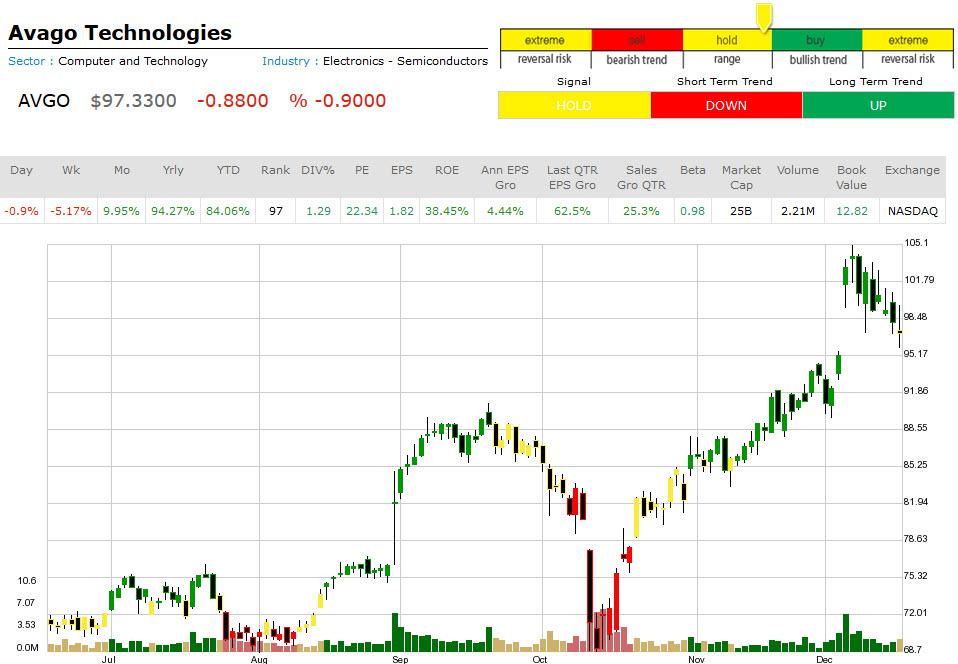
The long term trend of Avago Technologies is UP indicating that AVGO has experienced an UP trend for at least the past 180 trading days. Long term trends are key to understanding the starting point to the path of least resistance of a stocks price trend. The expected future trend bias is always strongest with the current trend.
Short Term TrendThe short term trend of Avago Technologies is DOWN, AVGO has been undergoing a short term DOWN over the past 7-10 days.
SignalThe current signal for Avago Technologies is HOLD indicating that the stock could be Pausing in it's trend. The current price trend is not Extreme. Stocks in extreme levels of price trend should be allowed to move out of the extreme range before a buy or sell decision should be made. As is the case for most trending momentum style stocks, much of the "reason" price action is not often known until well into the price trend. But earnings growth and management efficiency are key components to a foundation to a sustainable uptrend. We will focus on fundamental indications that can build a case for reasons why the stock should continue its current trend.
Strength RankRank is the rank of the stock vs. its peers. For example a Rank of 98 means the stock is out performing 98% of its peers over a 12 month period. A rank of 2 means the stock is outperforming 2% of its peers, in other words, 98% of its peers are out performing it. 98 is good, 2 is not so good. The current quarter is 40% of the weighting, so current performance is more significant to the rank.
The current rank for Avago Technologies is 97, this means that AVGO is out performing 97% of its peers. Stocks that have a rank of 80 or better, with support of all other analyses shown here, tend to advance the trend.
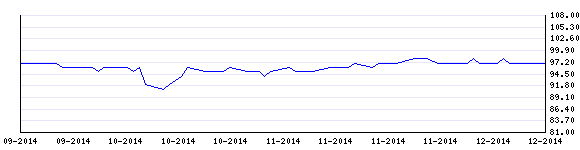
The 90 day trend of Rank
ROE - Return on equity is a measure of financial efficiency, gauging how much profit a company is able to generate from the company's financial net worth (that is, assets minus liabilities). Look for an annual return on equity of at least 20%. Thatœs the level that set apart the winning stocks from the ordinary. That doesn't always mean that a company with smaller ROE is a poor investment. Some big winners have of course been shy of 20% return on equity when they started their major up trends. When ROE is strong, it gives investors an indication that the company is better poised to continue a solid earnings performance. A high ROE is only part of the fundamentals a solid company should have. Superb earnings and sales growth, superior profit margins and big operating cash flow are other key elements investors must seek.
The Current ROE for Avago Technologies is 38.45%, indicating AVGO is currently functioning with High financial efficiency.
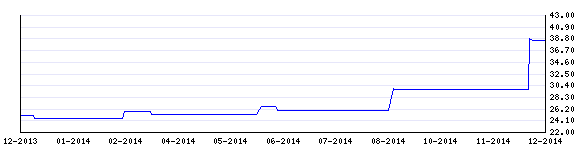
The 12 month chart trend of ROE
Annual EPS Growth - Companies with annual earnings growth of more than 20% are more likely to become leaders in up trending markets. While 20% Annual EPS growth is the minimum you should look for, don't be afraid to seek even better results. Studies have shown that the greatest winners in the past 30 years had an average 30% annual EPS growth rate when they started their strong up trends. You also can look for three straight years of rising EPS growth, with an average of at least 25%. These performance results often imply that a company is growing fast even if the general economy is slowing down or even in recession.
The current Annual EPS Growth for Avago Technologies is 4.44% which is less than the 30% average found is strong trending, fundamentally sound companies.
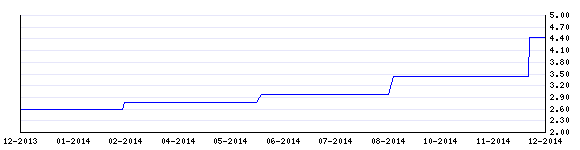
The 12 month chart trend of Annual EPS Growth
Quarterly EPS Growth - Outstanding earnings growth in the most recent quarters can be the single most important trait that identifies winners before they start their major price advances. Generally, the bigger the earnings growth, the better. Specifically, look for a company's earnings per share up at least 25-30% vs. the year-ago level in the most recent quarter or two. Gains of 50%, 100% or more are typical of strong market leaders even before they make their huge price moves. There's really nothing magic about this connection. Successful companies generate the strongest profit gains, regardless of the economic cycle. Even during periods when corporate profits are weak in general, you still find standouts that achieve massive earnings growth.
The current Quarterly EPS Growth for Avago Technologies is 62.5% which is greater than the 25% average found is strong trending stocks even during or before huge price moves.
The 12 month chart trend of Quarterly EPS Growth
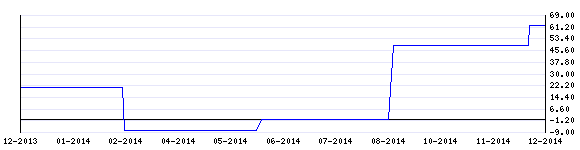
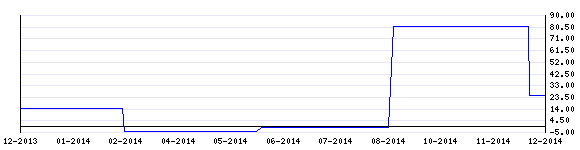
Quarterly Sales growth - A company's annual and quarterly rate of increase in revenues (sales). A measure of growth and success as long as it is accompanied by an equally strong rate of increase in earnings per share. You want to see both in a potential investment. A company's quarterly EPS gain should be supported by an increase in revenue (sales) of at least 25% or at least by an acceleration in sales growth in the past few quarters. You also should watch out for earnings growth that comes amid falling sales. Companies with declining revenue often boost their EPS results through layoffs or other cost cuts, especially in an uncertain economic environment. But this isn't a sustainable approach, and it's definitely not as desirable as profit gains that come from higher revenue. Recent quarterly sales results are more critical when it comes to researching stocks.
The current Quarterly Sales Growth for Avago Technologies is 25.3% which is greater than the 25% average found is strong trending stocks.
The 12 month chart trend of Quarterly Sales Growth
Dividend Yield
Dividend yield is the annual dividend income per share received from a company divided by its current share price. Normally investors would like to see a dividend yield between 2% and 20% for a dividend paying company. The dividend yield is an important factor to consider when investing in dividend paying stocks. Dividend yield is a financial ratio that reflects the % of profits a company makes of the dividend payments over the course of a year. For example if a stock pays an annual dividend of $2 and is trading at $50 a share, it would have a dividend yield of 4%.
The current Dividend Yield for Avago Technologies is 1.29%.
Stocks Historical Trading Characteristics.
Trade Stats for AVGO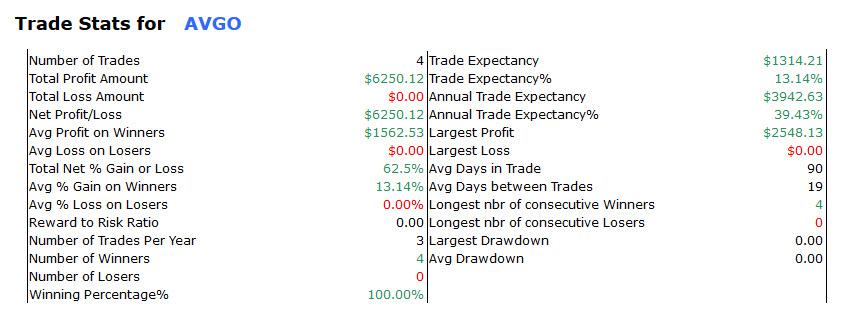
Backtesting a stock can provide investors with critical statistical data. These results give you an informed perspective on how a stock trades within your chosen buying and selling method of analysis. The definition of trade expectancy is defined as: trade expectancy = (probability of win * average win) - (probability of loss * average loss). If the calculation returns a positive number, a trader should make money over time.
The average percentage gained on positive, money making trades was 13.14%. While the average percent loss on money losing trades was 0.00%.
Trade expectancy includes both winners and losers. Trade expectancy is displayed as a percentage. This backtest displays the dollar value, percentage, annual trade expectancy, and annual percent. Annual expectancy is the trade expectancy percentage multiplied by the number of trades per year.
The Trade expectancy % for AVGO over the past year is 13.14%. The number of trades generated per year was 3 giving an Annual Trade Expectancy of 39.43%
The average days in a trade is 90 and the average days between trades is 19.
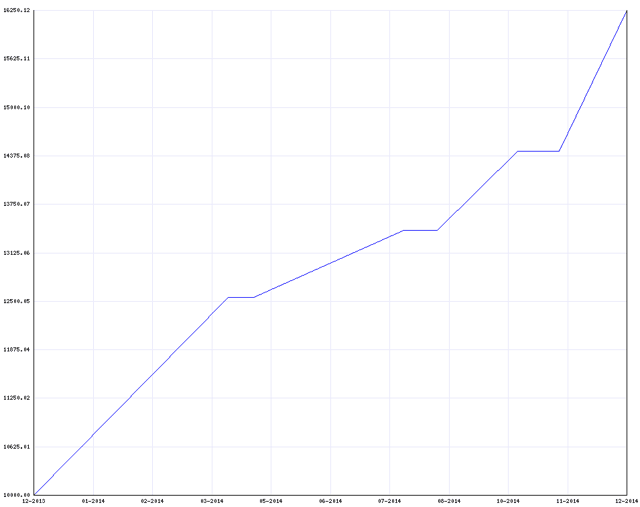
With any method of analysis that uses past performance, it can be said that past performance is not indication of future performance. What is does provide is a probabilistic look at a stock's price activity characteristics over time.
The historical Profit and loss curve of a $10,000 shows
Disclaimer: There is no guarantee past performance will be indicative or future results. No assurance can be given that any implied recommendation will be profitable or will not be subject to losses. All Clients should understand that the results of a particular period will not necessarily be indicative of results in future periods. The results and examples used in our advertisements, books, videos, websites or any other media are based on hypothetical trades. Plainly speaking, these trades were not actually executed. Hypothetical or simulated performance results have certain inherent limitations. Unlike an actual performance record, simulated trades do not represent actual trading. Also, since the trades have not actually been executed, results may have overcompensated or undercompensated for the impact, if any, of certain market factors such as lack of liquidity. Clients may have done better or worse than the results portrayed. No representation is being made that any account will or is likely to achieve profits or losses similar to those shown. No independent party has audited the hypothetical performance contained at this Web site, nor has any independent party undertaken to confirm that they reflect the trading method under the assumptions or conditions specified hereafter. While the results presented at this Web site are based upon certain assumptions believed to reflect actual trading conditions, these assumptions may not include all variables that will affect, or have in the past affected the execution of trades indicated by Market Trend Signal. Results do not account for commissions or slippage. Because Clients may be involved in trades at different times and may use various exit approaches, they may or may not have received the best available price on the purchase or the sale of a position. The simulation assumes purchase and sale prices believed to be attainable. In actual trading, prices received may or may not be the same as the assumed order prices.
Condition of Use, Notices and Revisions - If you choose to visit and navigate markettrendsignal.com your visit and any dispute over privacy, terms and conditions are subject to this policy and our Legal Notices including limitations on damages, arbitration of disputes, and application of the law of the state of Utah. Information on the web site, in promotional materials online and off are subject to change without prior knowledge and consent pursuant to the laws and regulations on the state and federal levels.
GENERAL RISKS OF TRADING AND INVESTING - (1) You may lose money trading and investing. (2) Past performance is not necessarily indicative of future results. (3) Hypothetical or simulated performance is not indicative of future results. (4) Don't enter any trade without fully understanding the worst-case scenarios of that trade. Do NOT trade with money you cannot afford to lose. Important Information & Terms Of Use: The contents of this website, the online stock screening software, associated charts, statistical analytical tools and all accompanying web pages, are the sole property of markettrendsignal.com. All rights reserved. Any reproduction, passing on, lending, hiring, copying, or reselling of this content, in any original, edited, or adapted format, without the prior written permission of the owner, is strictly prohibited. All analytical content provided within this site are a technical treatise, aimed purely to educate users on the technical aspects and value of intelligent, mathematically based research tools, supported charting and advanced technical analyses. Neither the charts nor the contents of this website, constitutes in any way or form, an invitation to buy or sell stocks, or to partake in any other financial activity by way of any financial instrument, and is not calculated to lead directly or indirectly to persons doing so. The user of this site fully accepts that the developers, author, and owners of the site, are purely educators of continually improving, evolutionary stock trading analysis, stock screening and charting technology, a method found to be valuable to them, which the user may find useful when embarking upon trading as a basis upon which to build his/her own trading programs. The developers, author and owners of markettrendsignal.com are not investment advisors, stock brokers or brokerage and thus any decision to embark upon trading with real funds based on any information contained within this site, is the users` own, sole decision and responsibility, and any subsequent profits or losses resulting from participating in the markets with real funds, rests solely with each individual person/user, and not with the developers, author or owners of markettrendsignal.com. Further, the user accepts that the data and chart information is not guaranteed to be accurate at all times, and that the publisher is not accountable for any errors. The user is advised not to rely solely on this data, but rather to double check any data points (including individual stock prices) published via his/her own independent sources. All stock data quoted is at least 15 minutes delayed. The user understands and acknowledges that as a general rule, past performance is not necessarily indicative of future performance. All stock price information is provided and transmitted as received from independent third party data sources. You must contact your stock brokerage to make stock and ETF transactions. Copyright 2013