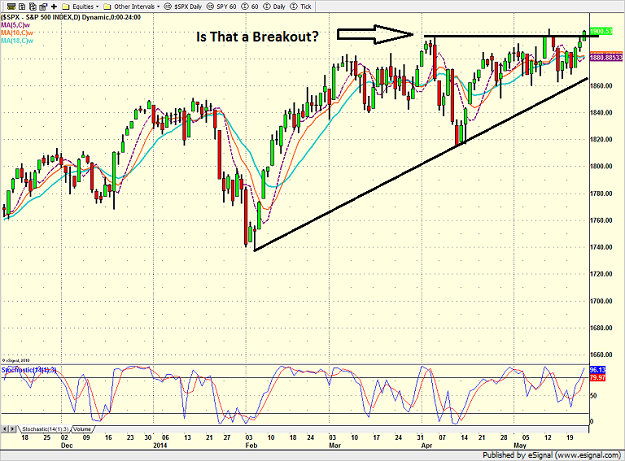
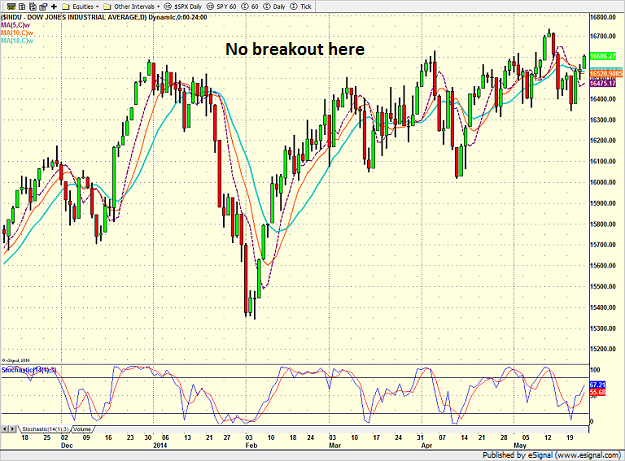
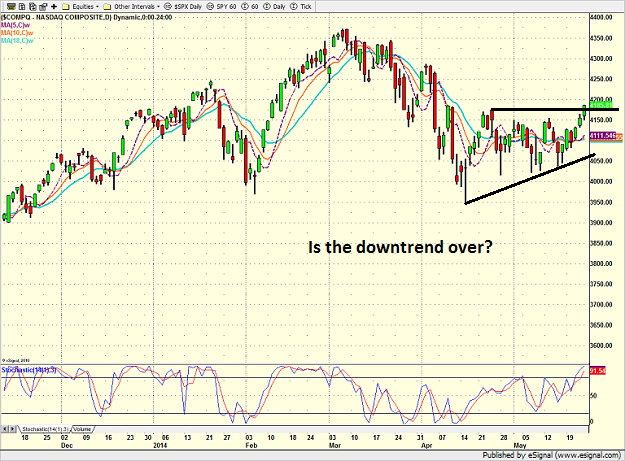
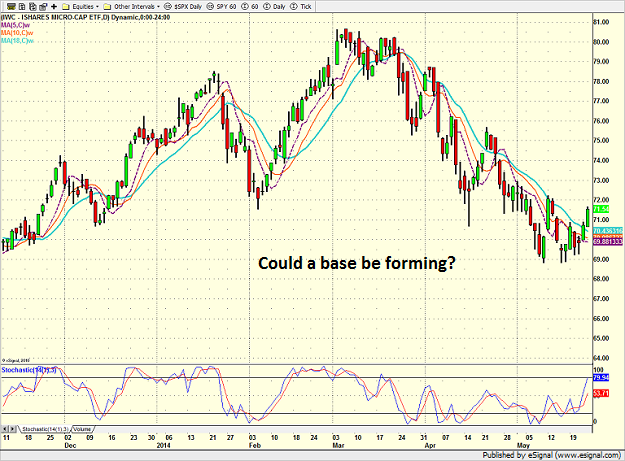
| Daily State of the Markets It is safe to say that the current stock market is frustrating. But unlike 2013, when the environment favored the bulls for the vast majority of the year and it was the bears that wound up pounding their heads up against the wall, this year, both teams appear to be experiencing some frustration. The bottom line is simple: From a big-picture standpoint, stocks won't go up and yet, the S&P 500 can't seem to go down either. While the S&P 500 finished Friday at a fresh all-time high, it did so by the slimmest of margins. Take a look at the chart below. Is that a breakout? Or simply a set-up for another in a long string of "fake outs"? S&P 500 Daily Usually, when such a question occurs, it pays to review the charts of the other major indices. In short, if the DJIA, NASDAQ, and/or Russell 2000 confirm the move in question, it is safe to assume that a breakout is a breakout. However, in this case, nothing is clear. Dow Jones Industrial Average Daily In looking at the chart of the Dow, it is clear that there is no breakout confirmation evident. In fact, there is still some important resistance overhead to deal with. The NASDAQ, which was impacted by the recent momentum meltdown couldn't be farther from confirming an upside breakout either. NASDAQ Daily However, the good news is that an argument can be made that the downtrend in the NASDAQ may have ended. In order to confirm that the worst of the decline is behind it, the NASDAQ will need to continue to move up in the coming week and, perhaps more importantly, NOT fall back below the 4150 area. On the other hand, the chart of the micro-caps, which bore the brunt of the mo-mo meltdown, continues to look ugly. iShares Micro-Cap ETF (IWC) Daily However, those seeing the glass as half full will argue that a base could be forming in the micro-cap space. And as you will recall, the key to the overall market moving up from here is for the micro-caps to STOP going down. They don't necessarily need to rebound. No, these beaten-down stocks just have to stabilize. So, Is The Environment Improving or Not? Whenever this type of environment occurs, it is usually best to put one's emotions aside and review the readings of some market indicators. In short, it can be quite helpful to look at cold, hard numbers when things are "iffy" To be clear, it is a good practice to review market indicators on a daily basis. However, looking at indicators over different time frames is an important way to diversify one's analysis. So this morning, we will review the readings as well as the implications of our intermediate-term oriented, weekly environment model. The "State" of the Market Environment Although there are some overlapping areas, the Weekly Environment Model is comprised of ten individual indicators or models. These ten can then be broken down into the following categories: tape, trend, sentiment, economic, monetary, and the overall risk environment. In terms of weighting, the majority of the model weight is given to tape and trend indicators (60 percent) while the "external" factors account for 40 percent of the model. This fits with our view that one's overall objective is to stay in line with what the market IS doing. In short, whenever there are questions, the price/tape action of the market should always be viewed the final arbiter. In addition, tape and trend indicators serve as excellent stop-loss signals for those times when the market's moves diverges from the "logic" of things like economics, news or earnings. In order to give you an incentive to continue reading, let's first review the performance of this particular model. Due to changes in data availability, the overall model was reworked at the end of 2011. However, the live performance hasn't been too bad. In 2012, using the leveraged ProShares Ultra S&P 500 (NYSE: SSO) when the model was positive, the ProShares Short S&P 500 (NYSE: SH) on negative signals, and a cash equivalent on neutral signals, the test of the model would have produced a return of +46.2% (compared to the S&P 500 cash index return of +16.3%). And then in 2013, the model's return would have been +38.30% versus S&P 500's return of +33.26%. So, while the history isn't long, we do believe it is worth watching what this model has to say each week. Since the explanation of the models and indicators that make up the weekly market environment model as well as the analysis of the current readings covers a fair amount of ground, we will break the review up this week. This morning we will take a look at the state of tape and trend indicators. The Trend Indicators Let's start with the easy stuff - the trend indicators. The weekly environment model contains three indicators that are dedicated to the trend of the overall market. For starters, we rate the short-term trend of the S&P 500. For the purposes of this model, we define short term as between five and fifteen trading days. Next is the intermediate-term trend of the market. Here we focus primarily on the market relative to its 10-week weighted moving average (which we move forward two periods). And finally, we look at our cycle composite, which is combination of the one-year seasonal, four-year presidential, and ten-year decennial cycles. Currently, our short-term trend rating is moderately positive, as the S&P is above its short-term moving averages, which themselves are also moving higher at this time. See the first chart in this report if there are any doubts about this rating. The rating of the intermediate-term trend is positive. A quick peek of the S&P 500 weekly chart versus its 10-week moving average should confirm this rating. S&P 500 Weekly And finally, our cycle composite suggests that stocks should move higher next week. So the rating for the cycle composite is positive. When assigning a score of +1 for positive readings, 0 for neutral readings and -1 for negative readings, the overall rating for our trend components comes in at +3 for the upcoming week, which is positive. The Tape Indicators The weekly environment model incorporates three "tape" indicators. These are the indicators that tell us the internal health of the market and helps to determine the "oomph" behind a move in either direction. The tape indicators include a breadth-confirmation system, a review of the supply/demand volume, and a model that rates the technical health of more than 100 S&P industry groups. Currently the tape indicators remain fairly strong. The breadth-confirmation system is positive as both the trend of the market and of the stock-only advance/decline line are above their appropriate smoothings. Next, the supply/demand volume relationship indicator is neutral at this time. Although demand volume remains well above supply at this stage, the trend of demand volume is down. And finally, our model that rates the technical health of more than 100 industry groups is moderately positive at this time. So, while these indicators are all intermediate-term or longer in nature, the group as a whole is positive. The bottom line is that both the trend and tape components of the overall environment model are currently positive - albeit not strongly so. Next we will take a look at the sentiment, monetary, economic, risk, and valuation indicators. Looking For Investment Management Help? If you are looking for help with money management, check out Heritage Capital Management's Active Risk Manager Service - or call Heritage for more information at (630) 250-4700. ALL NEW: The Next Generation of the Daily Decision system is now available to clients of Heritage Capital. The upgraded system utilizes swing trading and mean reversion strategies during neutral market environments, multiple indices for long positions, incremental moves in and out of the market, multiple managers and multiple strategies - with the overall goal being reduced volatility, fewer and less impactful whipsaws, and a "smoother ride." To learn more about the "Next Generation" system, Read the Research Report Turning to This Morning... Although the situation in Ukraine remains unsettled and there are new tensions between China and Vietnam after a fishing boat was sunk in disputed waters, global markets have improved a fair amount since Wall Street closed on Friday. European bourses that were open on Monday showed strong gains and are up again today. In the U.S. futures are pointing to a stronger open on Wall Street. The question, of course, is if the early gains will hold given that the S&P will be trading at all-time highs. Pre-Game Indicators Here are the Pre-Market indicators we review each morning before the opening bell... Major Foreign Markets: Crude Oil Futures: -$0.31 to $104.04 Gold: -$8.80 at $1282.90 Dollar: higher against the yen, euro and pound. 10-Year Bond Yield: Currently trading at 2.537% Stock Futures Ahead of Open in U.S. (relative to fair value): Thought For The Day... "Price is what you pay. Value is what you get." -Warren BuffettPositions in stocks mentioned: none Follow Me on Twitter: @StateDave The opinions and forecasts expressed herein are those of Mr. David Moenning and may not actually come to pass. Mr. Moenning's opinions and viewpoints regarding the future of the markets should not be construed as recommendations. The analysis and information in this report and on our website is for informational purposes only. No part of the material presented in this report or on our websites is intended as an investment recommendation or investment advice. Neither the information nor any opinion expressed nor any Portfolio constitutes a solicitation to purchase or sell securities or any investment program. The opinions and forecasts expressed are those of the editors of StateoftheMarkets.com and may not actually come to pass. The opinions and viewpoints regarding the future of the markets should not be construed as recommendations of any specific security nor specific investment advice. One should always consult an investment professional before making any investment. Any investment decisions must in all cases be made by the reader or by his or her investment adviser. Do NOT ever purchase any security without doing sufficient research. There is no guarantee that the investment objectives outlined will actually come to pass. All opinions expressed herein are subject to change without notice. Neither the editor, employees, nor any of their affiliates shall have any liability for any loss sustained by anyone who has relied on the information provided. The analysis provided is based on both technical and fundamental research and is provided "as is" without warranty of any kind, either expressed or implied. Although the information contained is derived from sources which are believed to be reliable, they cannot be guaranteed. The information contained in this report is provided by Ridge Publishing Co. Inc. (Ridge). One of the principals of Ridge, Mr. David Moenning, is also President and majority shareholder of Heritage Capital Management, Inc. (HCM) a Chicago-based money management firm. HCM is registered as an investment adviser. HCM also serves as a sub-advisor to other investment advisory firms. Ridge is a publisher and has not registered as an investment adviser. Neither HCM nor Ridge is registered as a broker-dealer. Employees and affiliates of HCM and Ridge may at times have positions in the securities referred to and may make purchases or sales of these securities while publications are in circulation. Editors will indicate whether they or HCM has a position in stocks or other securities mentioned in any publication. The disclosures will be accurate as of the time of publication and may change thereafter without notice. Investments in equities carry an inherent element of risk including the potential for significant loss of principal. Past performance is not an indication of future results. |
The State Of The Bull Market: What Do The Models Say?
Seeking Alpha's Disclosure: Past performance is no guarantee of future results. No recommendation or advice is being given as to whether any investment is suitable for a particular investor. Any views or opinions expressed above may not reflect those of Seeking Alpha as a whole. Seeking Alpha is not a licensed securities dealer, broker or US investment adviser or investment bank. Our analysts are third party authors that include both professional investors and individual investors who may not be licensed or certified by any institute or regulatory body.