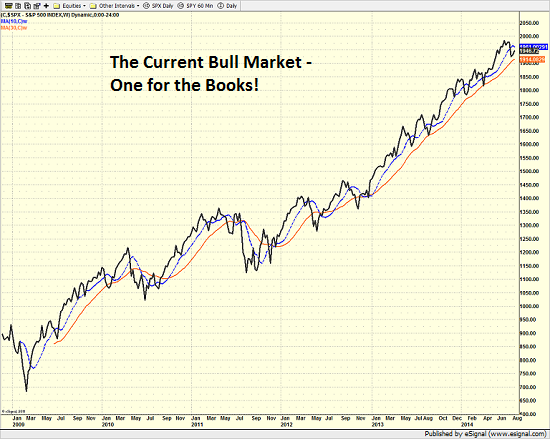
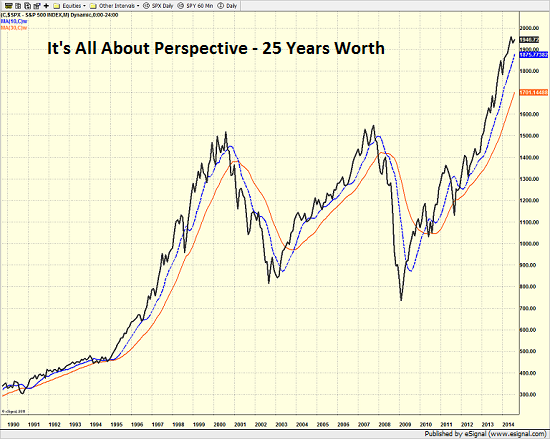
| Daily State of the Markets Everybody knows that the current bull market has been one for the ages. Everybody who has been long stocks for the last few years has likely enjoyed the ride. Everybody knows that the current bull market is getting old. And yet, everybody also knows that this market has some "issues." In response, just about everybody in the game - including yours truly - has penned a piece or three encouraging investors to exhibit some caution toward the stock market. After the two brutal bear markets that ensued once the "good times" in the markets ended in 2000 and 2008, investors can't be blamed for being a little squeamish right about now. Take a look at the charts below and see if you don't start feeling a little acrophobic. The first chart shows the S&P 500 on a weekly basis since the start of the current run for the roses. This is what a gain of 190 percent looks like. S&P 500 - Weekly Sure it has been a struggle at times. And yes, there have been some scary moments including the Flash Crash, the various European Debt/Greece Crises, the U.S. Debt Downgrade, the Fiscal Cliff, etc. But the key is that had investors found a way to get into stocks at just about any point from March 2009 through 2012, they would have been handsomely rewarded. Gaining Some Perspective Speaking of handsome rewards, take a look at the next chart below. This is a monthly chart of the S&P 500 over a 25-year period. As is readily apparent, there have been some good times. S&P 500 - Monthly Oh, and as you are no doubt aware, there have been some bad times - no, make that some very, very bad times as well. Therefore, just about everybody in the game these days is worried about what happens when this bull runs out of room to run. The Big Concern - Valuations Other than the concept of the Fed exiting their uber-easy monetary policy next year, one of the most popular concerns about the stock market is the topic of valuation. In short, a great many folks contend that stocks are currently overvalued and some suggest that this market is wildly overvalued. The problem is there are about a zillion ways to measure stock market valuation. Therefore, like art, the judgement of whether or not stocks are "expensive" or "cheap" usually lies in the eyes of the beholder. Long-time readers know that this is not exactly the first go-round on this topic. In fact, we like to sit down with the valuation indicators every six months or so just to make sure there are no surprises. So, in light of the fact that vacation season is in full swing (for the record, mine starts next week as my wife and I are exploring Iceland, England, and Scotland for 2.5 weeks) and the algos are trained on the news out of Ukraine, we figured this would be a good time to re-examine the issue. The Price-To-Earnings Ratio: The Granddaddy of Valuation Indicators There are currently at least 15 valuation indicators on my desk to be reviewed, including everything from P/E's to P/D's to models-of-models. So, without further ado, let's get started. The Price-to-Earnings Ratio (P/E) is by far, the most well-known and popular market valuation indicator. The ratio measures what investors are willing to pay for $1 of earnings on the major indices. History shows that when investors start to pay more and more for that $1 of earnings, the market quickly becomes extended. And surely as night follows day, bear markets tend to ensue when valuations become excessive. It would be logical then for an investor to pare back their exposure to market risk when valuations are high and to put money to work in the market when valuations are low. (All those, uttering the word, "duh" right about now, raise your hands!) But here's the rub. Over- and undervaluation are moving targets. Oh, and overvalued in one environment is merely neutral in another. Thus, unless valuations are out-and-out ridiculous (think 1999), investing money based on valuations can be a fool's game. However, attempting to glean where we are in terms of valuations within a given cycle can certainly be helpful in terms of managing risk/reward. The Current Numbers Another challenge in this arena is there are a plethora of ways to look at earnings and P/E ratios. Forward-looking, Trailing, GAAP earnings, Operating earnings, Median, and "normalized" to name a few. But let's start with the basics. According to Ned Davis Research, the average P/E based on one-year forward earnings over the past 31.5 years has been 14.46. The low as seen in 1985 when the P/E was below 8 and the high was seen in 2000 when the forward P/E exceeded 22.5. Currently, the one-year forward P/E ratio stands at 15.3, which, based on historical measures puts the market in the neutral zone in terms of valuation. And for perspective purposes, the current forward P/E is about the same as where it stood in 2007 and 1992-94. Next up is the trailing one-year P/E ratio. And in this instance we're looking at operating earnings. So, let's break it down. The 31.5 year average is 18.12. The low was in 1985 at around 10 and the high was seen in 1999 and 2002 when it was above 29. The current reading is 17.2. So, this indicator is also smack in the middle of the range. The problem with "operating earnings," of course, is that in this day and age, these numbers are basically whatever a company would like them to be. Therefore, it is a good idea to look at GAAP (generally accepted accounting principles) earnings, as there is a lot less fudging (oops, I mean "financial engineering") going on. The low of the 31.5 year range was under 10 in 1984. The high was more than a little artificial in 2009 at 140. The non-financial crisis high was in 2002 at about 50. The average has been 22.73. And the current reading is, drum roll please... 19.1. So, from a base-level P/E view since 1983, valuations would have to be considered neutral on balance. Next time we will look at some more variations on the Price-to-Earnings ratio. But so far at least, there is no reason to be yelling fire. Turning To This MorningThe news flow overnight has been fairly upbeat - or perhaps put a better way, not negative. The mood of the market improved a bit early this morning after Russian President Putin stated in a televised speech that Russia would do its utmost to stop the bloodshed in Ukraine. In addition, a fresh 5-day cease-fire between the Palestinians and Israel in Gaza was announced. Next, the Eurozone GDP data, while not great, was not any worse than anticipated. And finally, earnings season wraps up this week with largely better numbers coming out of the tech sector yesterday after the close and an abundance of retailer numbers today. U.S. futures currently point to a modestly higher open ahead of the Weekly Jobless Claims report. Pre-Game IndicatorsHere are the Pre-Market indicators we review each morning before the opening bell... Major Foreign Markets: Crude Oil Futures: -$0.16 to $97.43 Gold: -$3.20 at $1311.30 Dollar: lower against the yen and euro, higher vs. pound. 10-Year Bond Yield: Currently trading at 2.419% Stock Indices in U.S. (relative to fair value): Are you feeling inspired today? If not, shouldn't you be? Wishing you green screens and all the best for a great day,
David D. Moenning Positions in stocks mentioned: none Follow Me on Twitter: @StateDave (Twitter is the new Ticker Tape) AdvertisementWill You Be Ready For The NEXT Bear Market?  Heritage Capital Research's NextGen Active Risk Manager Can Help The opinions and forecasts expressed herein are those of Mr. David Moenning and may not actually come to pass. Mr. Moenning's opinions and viewpoints regarding the future of the markets should not be construed as recommendations. The analysis and information in this report is for informational purposes only. No part of the material presented in this report is intended as an investment recommendation or investment advice. Neither the information nor any opinion expressed nor any Portfolio constitutes a solicitation to purchase or sell securities or any investment program. Any investment decisions must in all cases be made by the reader or by his or her investment adviser. Do NOT ever purchase any security without doing sufficient research. There is no guarantee that the investment objectives outlined will actually come to pass. All opinions expressed herein are subject to change without notice. Neither the editor, employees, nor any of their affiliates shall have any liability for any loss sustained by anyone who has relied on the information provided. The analysis provided is based on both technical and fundamental research and is provided "as is" without warranty of any kind, either expressed or implied. Although the information contained is derived from sources which are believed to be reliable, they cannot be guaranteed. David D. Moenning, an advisor representative of CONCERT Wealth Management Inc. (CONCERT), is founder of Heritage Capital Advisors LLC, a legal business entity doing business as Heritage Capital Research (Heritage). Advisory services are offered through CONCERT Wealth Management, Inc., an SEC registered investment advisor. For a complete description of investment risks, fees and services review the CONCERT firm brochure (ADV Part 2) which is available from your Investment Representative or by contacting Heritage or CONCERT. Mr. Moenning is also the owner of Heritage Capital Management (HCM) a state-registered investment adviser. HCM also serves as a sub-advisor to other investment advisory firms. Neither HCM, Heritage, or CONCERT is registered as a broker-dealer. Employees and affiliates of Heritage and HCM may at times have positions in the securities referred to and may make purchases or sales of these securities while publications are in circulation. Editors will indicate whether they or Heritage/HCM has a position in stocks or other securities mentioned in any publication. The disclosures will be accurate as of the time of publication and may change thereafter without notice. Investments in equities carry an inherent element of risk including the potential for significant loss of principal. Past performance is not an indication of future results. |
Are Stocks Really Overvalued?

Seeking Alpha's Disclosure: Past performance is no guarantee of future results. No recommendation or advice is being given as to whether any investment is suitable for a particular investor. Any views or opinions expressed above may not reflect those of Seeking Alpha as a whole. Seeking Alpha is not a licensed securities dealer, broker or US investment adviser or investment bank. Our analysts are third party authors that include both professional investors and individual investors who may not be licensed or certified by any institute or regulatory body.