With the market having been trend-challenged for quite some time now, one of the things I'm doing in order to try and keep things in perspective is force myself to look at the market from different time frames. But before we begin today, I thought it might be a good idea to review the definitions of the micro-, short-, intermediate-, and long-term time frames. To clarify, I consider the micro-term to be less than 3 days. The short-term is 3 days to 3 weeks. We define intermediate-term as 3 weeks to 6 months. And then long-term is anything longer than 6 months.
So today, let's take a readers digest-version look at the intermediate-term action. The good news is that the S&P 500 is still only a stone's throw from an all-time high, remains above its 10-week moving average, and the moving average itself is moving higher. So, from a technical perspective, the intermediate-term trend can be rated moderately positive. The bad news is that market internals are weakening, meaning that the current move is anything but robust. While this situation can change if the bulls can reclaim their long-lost market mojo in the near-term, it is important to recognize that our primary market model, which is designed to indicate whether risk factors are high, low, or uncertain, tells us that the overall environment remains only moderately positive. And for those keeping score at home, history tells us that this type of model reading favors the bulls, albeit only modestly so.
Technical TakeOne of the biggest challenges in attempting to provide daily commentary on the markets is to somehow avoid saying the same darn thing day in and day out. However, at this stage of the game it is sooo tempting to simply type, "see yesterday's comments, and the day before that, and the day before that!" Clearly stocks remain trapped in a sideways consolidation pattern, with no end in sight. And if you are looking for an indicator to help you determine when stocks break important support or resistance zones, check out the Donchian Channel - the bands have been quite helpful this year. It is also important to note that the all-important 150-day moving average currently resides at 2050. And with the March low down at 2040, it would appear that a confirmed break of the 2040 area would be meaningful.
S&P 500 Index - Daily 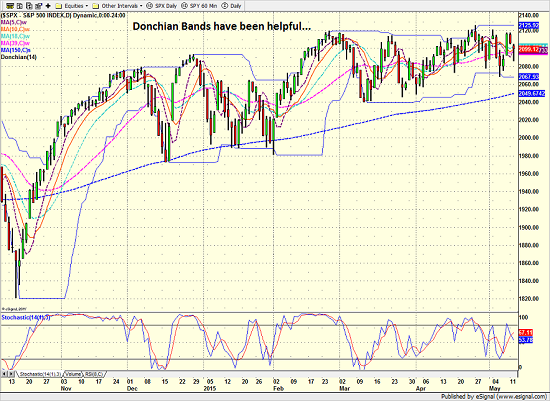
View Larger Image
If you don't like something, change it. If you can't change it, change your attitude. -Dr. Maya Angelou
Current Market DriversWe strive to identify the driving forces behind the market action on a daily basis. The thinking is that if we can both identify and understand why stocks are doing what they are doing on a short-term basis; we are not likely to be surprised/blind-sided by a big move. Listed below are what we believe to be the driving forces of the current market (Listed in order of importance).
1. The State of Interest Rates
2. The State of Fed/ECB/PBoC Policy
3. The State of the U.S. Economy
4. The State of the U.S. Dollar
We believe it is important to analyze the market using multiple time-frames. We define short-term as 3 days to 3 weeks, intermediate-term as 3 weeks to 3 months, and long-term as 3 months or more. Below are our current ratings of the three primary trends:
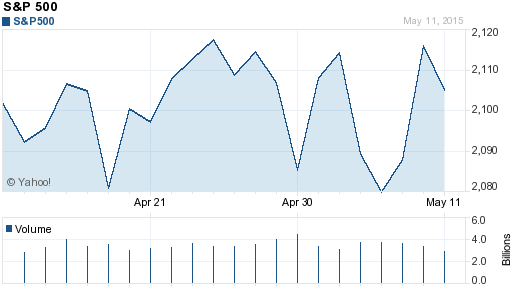
Short-Term Trend: Neutral
(Chart below is S&P 500 daily over past 1 month)
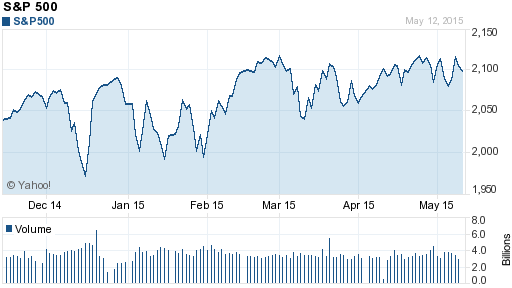
Intermediate-Term Trend: Moderately Positive
(Chart below is S&P 500 daily over past 6 months)
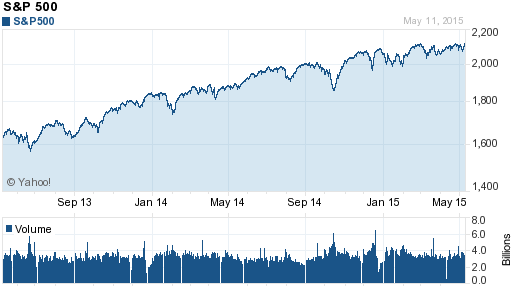
Long-Term Trend: Positive
(Chart below is S&P 500 daily over past 2 years)
Key Technical Areas:
Traders as well as computerized algorithms are generally keenly aware of the important technical levels on the charts from a short-term basis. Below are the levels we deem important to watch today:
- Key Near-Term Support Zone(s) for S&P 500: 2080
- Key Near-Term Resistance Zone(s): 2120
Momentum indicators are designed to tell us about the technical health of a trend - I.E. if there is any "oomph" behind the move. Below are a handful of our favorite indicators relating to the market's "mo"...
- Trend and Breadth Confirmation Indicator (Short-Term): Neutral
- Price Thrust Indicator: Negative
- Volume Thrust Indicator: Negative
- Breadth Thrust Indicator: Neutral
- Bull/Bear Volume Relationship: Moderately Positive
- Technical Health of 100+ Industry Groups: Moderately Positive
Markets travel in cycles. Thus we must constantly be on the lookout for changes in the direction of the trend. Looking at market sentiment and the overbought/sold conditions can provide "early warning signs" that a trend change may be near.
- S&P 500 Overbought/Oversold Conditions:
- Short-Term: Neutral
- Intermediate-Term: Overbought - Market Sentiment: Our primary sentiment model is Neutral .
One of the keys to long-term success in the stock market is stay in tune with the market's "big picture" environment in terms of risk versus reward.
- Weekly Market Environment Model Reading: Moderately Positive
Wishing you green screens and all the best for a great day,

David D. Moenning
Founder and Chief Investment Strategist
Heritage Capital Research
Indicator Explanations
Trend and Breadth Confirmation Indicator (Short-Term) Explained: History shows the most reliable market moves tend to occur when the breadth indices are in gear with the major market averages. When the breadth measures diverge, investors should take note that a trend reversal may be at hand. This indicator incorporates an All-Cap Dollar Weighted Equity Series and A/D Line. From 1998, when the A/D line is above its 5-day smoothing and the All-Cap Equal Weighted Equity Series is above its 25-day smoothing, the equity index has gained at a rate of +32.5% per year. When one of the indicators is above its smoothing, the equity index has gained at a rate of +13.3% per year. And when both are below, the equity index has lost +23.6% per year.
Price Thrust Indicator Explained: This indicator measures the 3-day rate of change of the Value Line Composite relative to the standard deviation of the 30-day average. When the Value Line's 3-day rate of change have moved above 0.5 standard deviation of the 30-day average ROC, a "thrust" occurs and since 2000, the Value Line Composite has gained ground at a rate of +20.6% per year. When the indicator is below 0.5 standard deviation of the 30-day, the Value Line has lost ground at a rate of -10.0% per year. And when neutral, the Value Line has gained at a rate of +5.9% per year.
Volume Thrust Indicator Explained: This indicator uses NASDAQ volume data to indicate bullish and bearish conditions for the NASDAQ Composite Index. The indicator plots the ratio of the 10-day total of NASDAQ daily advancing volume (i.e., the total volume traded in stocks which rose in price each day) to the 10-day total of daily declining volume (volume traded in stocks which fell each day). This ratio indicates when advancing stocks are attracting the majority of the volume (readings above 1.0) and when declining stocks are seeing the heaviest trading (readings below 1.0). This indicator thus supports the case that a rising market supported by heavier volume in the advancing issues tends to be the most bullish condition, while a declining market with downside volume dominating confirms bearish conditions. When in a positive mode, the NASDAQ Composite has gained at a rate of +38.3% per year, When neutral, the NASDAQ has gained at a rate of +13.3% per year. And when negative, the NASDAQ has lost at a rate of -8.5% per year.
Breadth Thrust Indicator Explained: This indicator uses the number of NASDAQ-listed stocks advancing and declining to indicate bullish or bearish breadth conditions for the NASDAQ Composite. The indicator plots the ratio of the 10-day total of the number of stocks rising on the NASDAQ each day to the 10-day total of the number of stocks declining each day. Using 10-day totals smooths the random daily fluctuations and gives indications on an intermediate-term basis. As expected, the NASDAQ Composite performs much better when the 10-day A/D ratio is high (strong breadth) and worse when the indicator is in its lower mode (weak breadth). The most bullish conditions for the NASDAQ when the 10-day A/D indicator is not only high, but has recently posted an extreme high reading and thus indicated a thrust of upside momentum. Bearish conditions are confirmed when the indicator is low and has recently signaled a downside breadth thrust. In positive mode, the NASDAQ has gained at a rate of +22.1% per year since 1981. In a neutral mode, the NASDAQ has gained at a rate of +14.5% per year. And when in a negative mode, the NASDAQ has lost at a rate of -6.4% per year.
Bull/Bear Volume Relationship Explained: This indicator plots both "supply" and "demand" volume lines. When the Demand Volume line is above the Supply Volume line, the indicator is bullish. From 1981, the stock market has gained at an average annual rate of +11.7% per year when in a bullish mode. When the Demand Volume line is below the Supply Volume line, the indicator is bearish. When the indicator has been bearish, the market has lost ground at a rate of -6.1% per year.
Technical Health of 100 Industry Groups Explained: Designed to provide a reading on the technical health of the overall market, this indicator takes the technical temperature of more than 100 industry sectors each week. Looking back to early 1980, when the model is rated as "positive," the S&P has averaged returns in excess of 23% per year. When the model carries a "neutral" reading, the S&P has returned over 11% per year. But when the model is rated "negative," stocks fall by more than -13% a year on average.
Weekly State of the Market Model Reading Explained:Different market environments require different investing strategies. To help us identify the current environment, we look to our longer-term State of the Market Model. This model is designed to tell us when risk factors are high, low, or uncertain. In short, this longer-term oriented, weekly model tells us whether the odds favor the bulls, bears, or neither team.
Disclosures
The opinions and forecasts expressed herein are those of Mr. David Moenning and may not actually come to pass. Mr. Moenning's opinions and viewpoints regarding the future of the markets should not be construed as recommendations. The analysis and information in this report is for informational purposes only. No part of the material presented in this report is intended as an investment recommendation or investment advice. Neither the information nor any opinion expressed nor any Portfolio constitutes a solicitation to purchase or sell securities or any investment program.
Any investment decisions must in all cases be made by the reader or by his or her investment adviser. Do NOT ever purchase any security without doing sufficient research. There is no guarantee that the investment objectives outlined will actually come to pass. All opinions expressed herein are subject to change without notice. Neither the editor, employees, nor any of their affiliates shall have any liability for any loss sustained by anyone who has relied on the information provided.
The analysis provided is based on both technical and fundamental research and is provided "as is" without warranty of any kind, either expressed or implied. Although the information contained is derived from sources which are believed to be reliable, they cannot be guaranteed.
David D. Moenning, an advisor representative of CONCERT Wealth Management Inc. (CONCERT), is founder of Heritage Capital Advisors LLC, a legal business entity doing business as Heritage Capital Research (Heritage). Advisory services are offered through CONCERT Wealth Management, Inc., a registered investment advisor. For a complete description of investment risks, fees and services review the CONCERT firm brochure (ADV Part 2) which is available from your Investment Representative or by contacting Heritage or CONCERT.
Mr. Moenning is also the owner of Heritage Capital Management (HCM) a state-registered investment adviser. HCM also serves as a sub-advisor to other investment advisory firms. Neither HCM, Heritage, or CONCERT is registered as a broker-dealer.
Employees and affiliates of Heritage and HCM may at times have positions in the securities referred to and may make purchases or sales of these securities while publications are in circulation. Editors will indicate whether they or Heritage/HCM has a position in stocks or other securities mentioned in any publication. The disclosures will be accurate as of the time of publication and may change thereafter without notice.
Investments in equities carry an inherent element of risk including the potential for significant loss of principal. Past performance is not an indication of future results.