CAI International - Value, Growth or Both?
CAI International CAP has two main revenue streams, intermodal container (TEUs) leaser and TEU portfolio management. TEUs are used to transport materials and dry-bulk. Basically, CAP leases TEUs, both owned and managed, to shipping companies for a fee. There is also a railcar leasing segment at its infancy stage.
Value
Below are CAP's competitors in the field. The TEUs leasing companies are by far and large not expensive based on valuations.
Counter | Market Cap | P/E ttm | P/Cash Flow | P/B | Debt to Equity | Interest Coverage | Yield |
CAI International Inc. (CAP) | 422.56M | 7.3 | 3.9 | 1.52 | 3.15 | 3.8 | 0% |
Textainer Group Holdings Limited (TGH) | 1.48B | 7.6 | 5.4 | 1.98 | 2.27 | 4.3 | 5.60% |
TAL International Group, Inc. (TAL) | 1.12B | 9.6 | 3.7 | 1.9 | 4 | 2.6 | 7.20% |
SeaCube Container Leasing Ltd. (BOX) | 371.68M | 8.4 | 3.8 | 1.56 | 5.18 | 1.7 | 6.30% |
Data extracted from motley fool
A matrix that could be worrisome is the debt to equity ratio. Having more than 1 is usually frowned upon. However upon a closer inspection, TEUs leasing mostly has steady cash flow, the highly leveraged nature of the industry is more forgivable.
CAP is cheaper in terms of P/E, P/Cashflow and P/B as compared to peers. However it doesn't support any yield. For an industry that distributes a large portion of its cash flow, it is indeed unorthodox. Where then would the company spend its cash? We would revisit this point later.
A key point that should be brought to attention is the earning visibility of the company. 84% of all leases made are long-term leases. Using earnings from last quarter ($0.84) as guidance, I estimated that the minimum EPS for 2013 to be $2.82 or forward P/E 7.76 at the time of writing. Please note that this is under the assumption that expenses remain roughly the same.
I believe such valuations would support CAP in difficult marco environment.
Growth
Containerized trade growth is expected to increases by 7%. This brings opportunity to the industry.
Counter | Market Cap | Sales - 5 Yr Growth Rate (%) | EPS - 5 Yr Growth Rate (%) | Capital Spending - 5 Yr Growth Rate (%) | EPS (TTM) vs TTM 1 Yr Ago (%) |
CAI International Inc. (CAP) | 422.56M | 23.42 | 29.76 | 32.35 | 21.3 |
Textainer Group Holdings Limited (TGH) | 1.48B | 10.83 | 20.42 | 33.99 | -11.4 |
TAL International Group, Inc. (TAL) | 1.12B | 8.37 | 22.81 | 22.29 | 26.3 |
SeaCube Container Leasing Ltd. (BOX) | 371.68M | N.A. | N.A. | N.A. | 26.3 |
Data extracted from motley fool
CAI International Inc. (CAP)
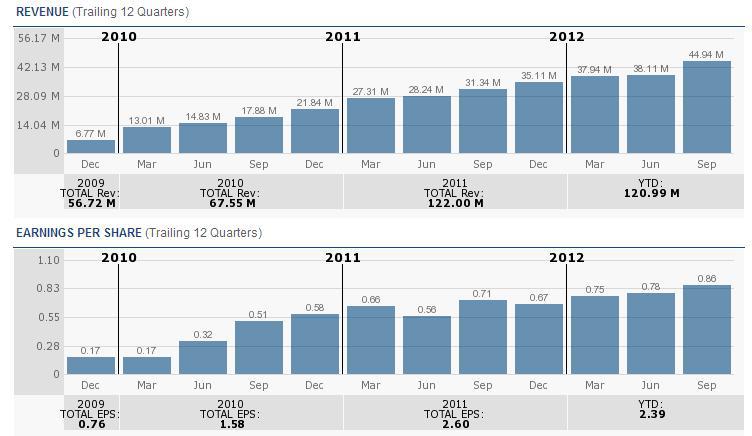 Graph extracted from motley fool
I believe the graph speaks for itself. We see a constant stream of both top-line and bottom-line growth.
To capture the increase, CAP has invested over 500mil in equipment over the year. Going forward, capital can be spent on acquiring managed portfolios or more TEUs spending. As CAP does not distribute dividend, it has more capital for CapEx. The rest of the capital is financed with debt.
"With the confirmation of these transactions, we now have approximately two-thirds of our debt in various term facilities with maturities ranging from two to 10 years and approximately one-third of our debt now has fixed interest rate with an average yield of less than 3.8%. We believe there will be further opportunities in the coming months to reduce our overall borrowing cost and fix rates on a higher percentage of our capital structure."
Extracted from earnings transcript 3Q 2012
3.8% is much lower than the dividends of 5+% distributed by their competitors who finances CapEx with equity.
Bottom Line
I believe that CAP meets the requirement for both value and growth, making it an attractive investment for the years to come.
Disclosure: I am long CAP.