I introduced the concept of market breadth in a post titled "The Secret Weapon of Technical Analysis." Based on current breadth readings, the equity market is overbought and due for a pullback. However, trading against the trend has a low probability of success. The following article examines several market breadth indicators and explains how to spot a change in the price trend.

Current Market Breadth Readings
One of the most common technical indicators is the 200-day moving average. When stocks are above their 200-day moving average, that's bullish. When stocks are below their 200-day moving average, the environment is bearish.
For individual stocks, this concept may have some merit. Unfortunately, when too many stocks are trading above their respective 200-day moving averages, market sentiment is too optimistic and the probability of a pullback increases. Conversely, when too many stocks are trading below their corresponding 200-day moving averages, the stage is set for a near-term bullish reversal.
Figure 1 below is a weekly candlestick chart of the $SPXA200R, which represents the percentage of stocks in the S&P 500 index trading above their individual 200-day moving averages. Extreme bullish readings occur between 70 percent and 80 percent. The blue horizontal line represents the 75% level.
Stocks can remain overbought or oversold for extended periods and simply entering the extreme territory is not sufficient justification for a contra-trend trade. Instead, the percent of stocks trading above their 200-day moving average should be extreme AND should decline for a one or possibly two-week period. That would represent the first confirmation of a prospective trend reversal.
The blue circled regions highlight bearish trend reversal confirmations in Figure 1 below. These regions closely match and typically precede the actual pullbacks in the S&P 500 Index (highlighted with blue circles in Figure 2 below).
Note that the percentage of issues above their corresponding 200-day moving averages is currently extremely high. However, the breadth indicator has not suffered a single weekly decline. While the risk of a pullback is elevated, the uptrend is intact and I never trade against an established, unbroken uptrend.
All of the charts below are available on Stockcharts.com.
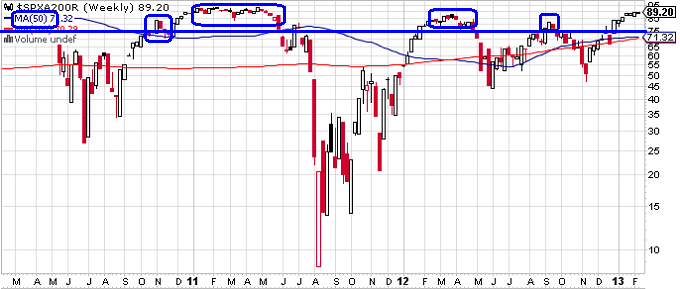
Figure 1: S&P 500 Index - % Above 200 MA 2-12-13 (StockCharts.com)
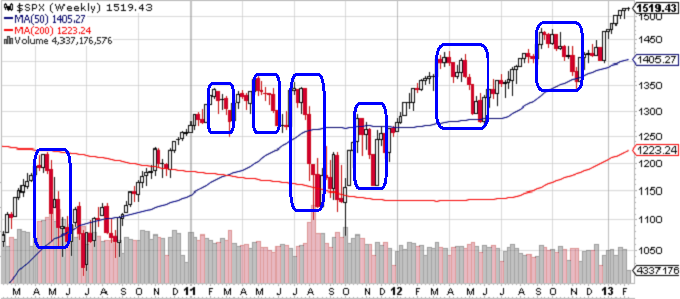
Figure 2: S&P 500 Index - Weekly Chart 2-12-13 (Stockcharts.com)
Another contrarian market breadth indicator is the percent of issues in a broad market index or on an exchange that are bullish based on the long-term point and figure method. If you would like a refresher on point and figure charting, please revisit "The Easiest Way to Identify Trends."
As was the case above, when the percent bullish indicator becomes extreme (70 percent to 80 percent), the probability of a reversal increases. Figure 3 below depicts the weekly percent bullish indicator for the S&P 500 index. The blue horizontal line represents the 75% warning level.
Figure 4 below depicts the weekly percent bullish indicator for all of the issues on the NYSE. The blue horizontal line represents the 70% warning level.
The blue circled regions in Figures 3 and 4 highlight bearish trend reversal confirmations based on the percent bullish indicator. Again, these regions closely match and typically precede the actual pullbacks in the S&P 500 Index in Figure 2 above.
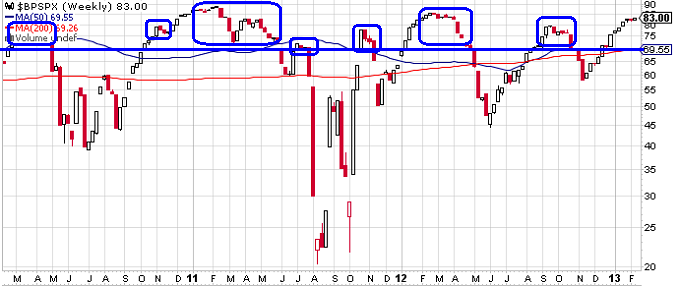
Figure 3: S&P 500 Index - % Bullish 2-12-13 (Stockcharts.com)
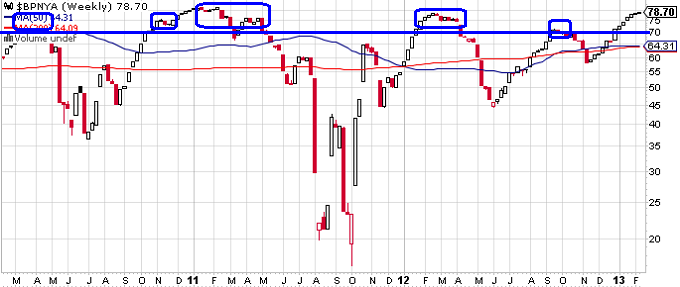
Figure 4: NYSE - % Bullish 2-12-13 (Stochcharts.com)
Confirmation of Trend Change
One or more weekly declines in one or more of the market breadth indicators is the first step in identifying a prospective trend reversal. However, before establishing a contra-trend trade, it would also be prudent to see evidence of a change in the actual price trend. There are many ways to do this:
- A break in the daily or weekly trendline (see "How to Draw Trendlines & Avoid Severe Losses.")
- One or more closes below a daily or weekly moving average
- A DMI crossover
- One of the many other trend confirmation indicators of your choice
Possible Investment Vehicles or Strategies
After confirming a trend change using both breadth and price, there are several ways to implement a bearish strategy. You could obviously short ETFs or futures. Futures are liquid and they trade overnight, which would allow you to eliminate gap risk by using stop loss orders that could be triggered after hours. Futures also have low commissions and tight bid-ask spreads. Finally, futures have a symmetric payoff function, which makes them easier to understand.
If you are an experienced option trader, you have many more investment alternatives. First, you could sell out-of-the money bear call spreads above the current market price (see Active Trader Article titled "The Science of Selling Options").
You could also execute a bearish diagonal spread, which I explained in detail in a January 2013 Active Trader article titled "Option Strategies for Bull-Market Reversals." Unfortunately, this article is not yet available for download.
Both of these strategies would allow you to profit - even if prices were to move slightly higher or remain unchanged. The positive yield (Theta) component of these strategies improves the percentage of profitable trades.
Regardless which strategy you choose, understand your exit strategy in advance and identify stop loss levels to control your risk if the trade moves against you.
Conclusion
When market breadth indicators are overbought and breadth and price both turn down and confirm a trend reversal, the probability of a market pullback increases significantly. Breadth is currently above the extreme thresholds for most if not all market breadth indicators. However, breadth has not yet begun to turn down and the price trend remains intact. Confirmed trend changes in breadth and price should signal a high probability reversal.
Brian Johnson
TraderEdge.Net
Disclosure: I have no positions in any stocks mentioned, and no plans to initiate any positions within the next 72 hours.