Swing traders rely on a diverse arsenal of technical indicators when analyzing stocks, and there are literally hundreds of indicators to choose from. But how is a new trader supposed to know which indicators are most reliable? Deciding which technical indicators to use can frankly be a bit overwhelming, but it doesn't have to be (nor should it be).
While learning to master our winning system for swing trading stocks and ETFs in the early years, we tested a plethora of technical indicators. Our conclusion was that most of the technical indicators served their intended purpose of increasing the odds of a profitable stock trade. However, we quickly discovered that using too many indicators only led to analysis paralysis. As such, we now avoid this problem by simply focusing on the tried and true basics of technical trading: price, volume, and support/resistance levels.
One of the easiest and most effective ways to find support and resistance levels is through the use of moving averages. Moving averages play a very big role in our daily stock analysis, and we rely heavily on certain moving averages to locate low-risk entry and exit points for the stocks and ETFs we swing trade.
For gauging price momentum in the very short-term (a period of several days), we have found the 5 and 10-day moving averages work very well. If, for example, a stock or ETF is trading above its 5-day MA, there is usually no good reason to sell. One possible exception is if the stock or ETF has made a 25-30% price advance within just a few days.
The 10-day MA is a great moving average for helping us ride the trend with a bit more "wiggle room" than provided by the ultra short-term 5-day MA.
For trend traders, no stocks or ETFs should be sold while they are still trading above their 10-day moving averages following a strong breakout. To understand why, compare the following daily charts of U.S. Oil Fund ($USO) and First Trust DJ Internet Index Fund ($FDN). First is $FDN:
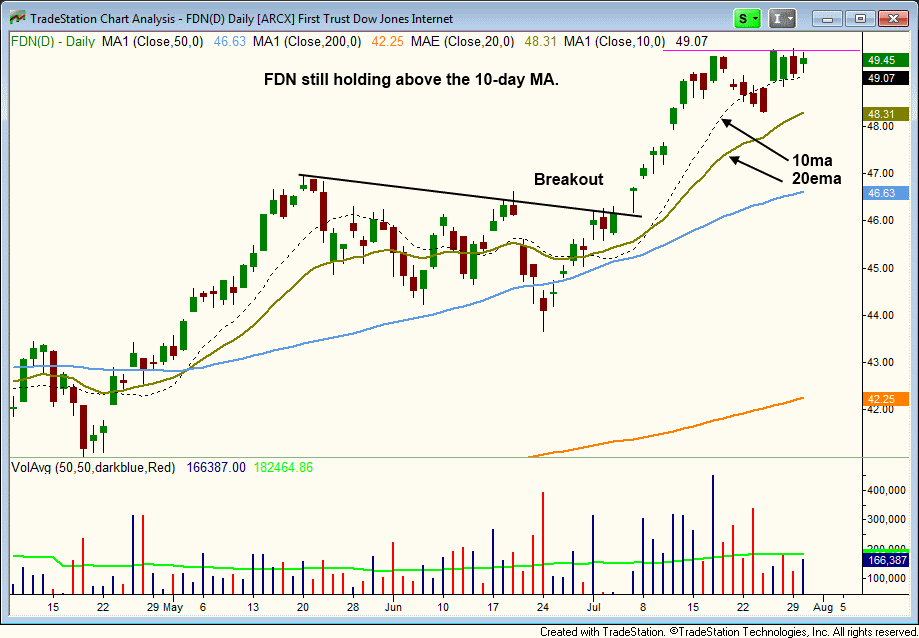
With the exception of a brief "shakeout" of just two days (a common and acceptable occurrence), notice that $FDN has been holding above its rising 10-day MA ever since breaking out in early July. This is a clear sign that the momentum from the breakout is still strong.
On the other hand, notice the difference on the daily chart of $USO:
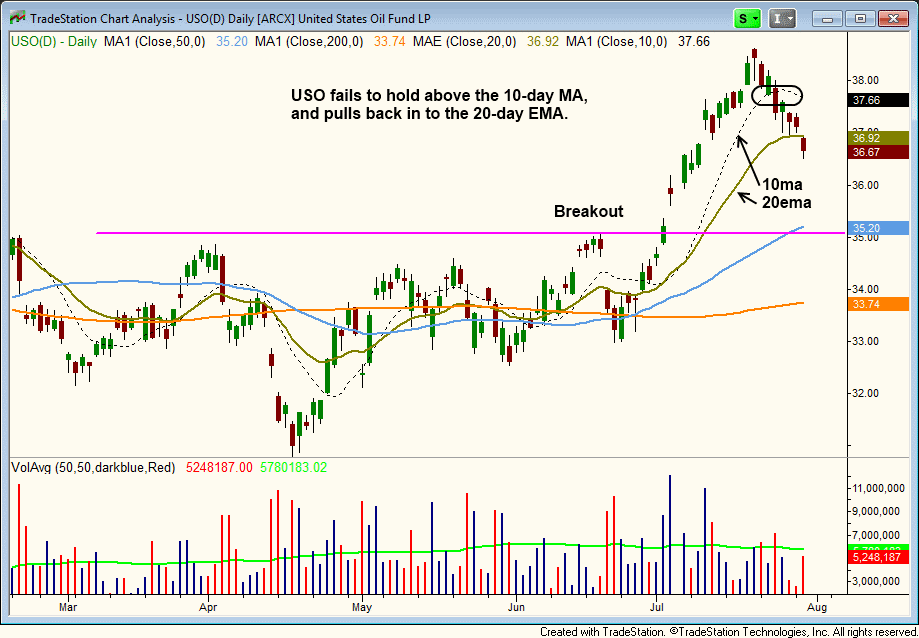
As you can see, $USO has failed to hold above its 10-day MA over the past week, which is a sign that bullish momentum from the recent breakout is fading. As such, we sold 25% of our existing position on July 25. It never hurts to lock in profits on partial share size when a breakout stock or ETF has broken below its 10-day moving average, as such price action frequently leads to a deeper correction.
Immediately after selling partial share size on the break of the 10-day MA, we were prepared to buy back those shares if the price action immediately snapped back higher within one to two days (as $FDN did). However, since that did not occur, we canceled our buy stop and continue to hold $USO with reduced share size and a small unrealized gain since the breakout entry.
While the 5 and 10-day moving averages are by no means a complete and perfect system for exiting a position, they allow us to stay with the trend in a winning trade (which helps us to maximize our trading profits). More importantly, using the 10-day moving average as a short-term indicator of support enables us to TRADE WHAT WE SEE, NOT WHAT WE THINK!
To learn our complete and winning stock trading system, check out our top-ranked Swing Trading Success Video Course. We guarantee you won't be disappointed!
Follow Us: 
![]()
![]()

This article first appeared on MorpheusTrading.com and is republished here with permission.
DISCLAIMER: There is a risk for substantial losses trading securities and commodities. This material is for information purposes only and should not be construed as an offer or solicitation of an offer to buy or sell any securities. Morpheus Trading, LLC (hereinafter "The Company") is not a licensed broker, broker-dealer, market maker, investment banker, investment advisor, analyst or underwriter. This discussion contains forward-looking statements that involve risks and uncertainties. A stock's actual results could differ materially from descriptions given. The companies discussed in this report have not approved any statements made by The Company. Please consult a broker or financial planner before purchasing or selling any securities discussed in The Wagner Daily (hereinafter "The Newsletter"). The Company has not been compensated by any of the companies listed herein, or by their affiliates, agents, officers or employees for the preparation and distribution of any materials in The Newsletter. The Company and/or its affiliates, officers, directors and employees may or may not buy, sell or have positions in the securities discussed in The Newsletter and may profit in the event the shares of the companies discussed in The Newsletter rise or fall in value. Past performance never guarantees future results.
© 2002-2013 Morpheus Trading, LLC
Reproduction without permission is strictly prohibited.