From 2001 to 2011, the spot gold commodity thrilled gold bugs with nearly an 800% gain over the course of a decade-long bull run.
Traders and investors of SPDR Gold Trust ($GLD), a popular ETF that follows the price of spot gold, also benefited quite nicely.
Yet, even the most impressive rallies of any stock market in the world eventually run out of gas and enter into significant corrections or bearish trend reversals.
For gold, that correction began in late 2011, and the precious metal has been in a downtrend ever since.
On the long-term monthly chart of $GLD below, check out the clear downtrend line that began nearly two years ago:
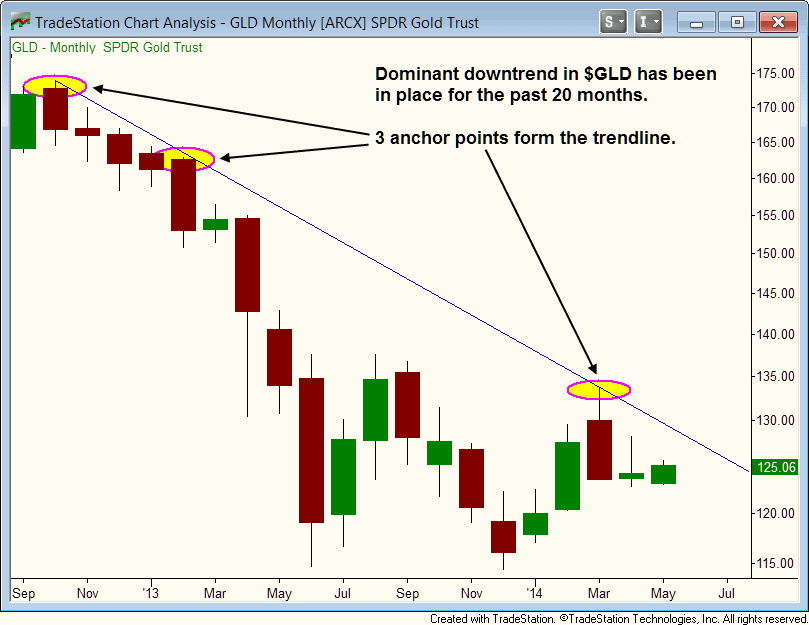
Although $GLD is still in a downtrend (until it convincingly breaks out above the $128 to $130 level), there are now 3 great reasons to buy gold in anticipation of a substantial, intermediate to long-term rally and/or bullish trend reversal.
Going into today (May 5), I have listed a gold ETF for potential buy entry in my nightly swing trading newsletter for the following three reasons:
1.) Double Bottom On $GLD Weekly ChartWhen looking to buy a stock or ETF that is in the process of reversing a lengthy downtrend, it is easy to make the mistake of buying too soon (before a convincing bottom is in place).
An easy way to avoid that problem is to wait for the formation of either a higher low or double bottom to form.
Drilling down to the shorter-term weekly chart below, notice the double bottom that clearly formed in December 2013 and January 2014:
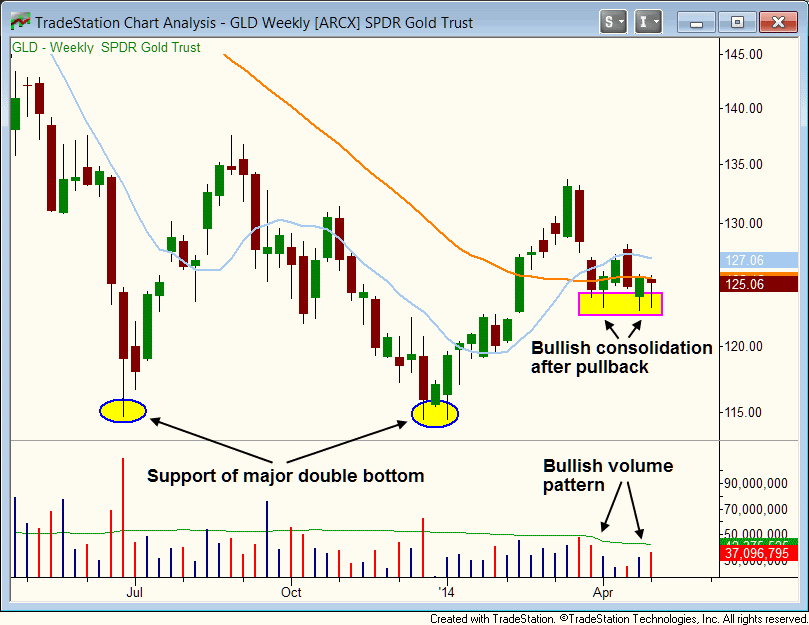
Although a double bottom is an encouraging sign that selling pressure in downtrending stocks/ETFs is evaporating, it is important to have additional price confirmation before buying.
With $GLD, the price confirmation that followed the double bottom has been developing over the past six weeks, in the form of...
2.) Bullish Consolidation, Reversal Candlesticks, And Volume PatternsFor the second week in row, and the third week within the past five weeks, $GLD tested and held support at the $123 area (pink rectangle on the chart above), then reversed to close near the highs of the week.
The multiple bullish reversal candles are a clear indication that bullish momentum is finally starting to dominate.
The 40-week moving average (orange line) has flattened out over the past few months, which is a bullish sign, but the 10-week moving average (teal line) has recently turned down.
As such, $GLD will need to deal with overhead resistance around the $127 - $128 area on its next rally attempt (the 20-month downtrend line also converges near this level).
Nevertheless, I really like the solid support that has formed near the $123 level, which could turn out to be the lows of the current correction off the recent swing high.
Finally, the volume pattern over the past six weeks has also been bullish overall.
Turnover dried up throughout the first three weeks of the six-week consolidation, then began expanding as the bullish reversal candlesticks formed over the past two weeks.
Lighter volume during the initial stages of consolidation is positive because it indicates the sellers are drying up, absorbing overhead supply and making it easier for the equity to move higher when the buyers return.
The higher volume that followed over the past two weeks is bullish because each of the two bullish reversal candlesticks that formed.
3.) Gold Is A Nice Hedge In A Shaky MarketThe third reason to buy a gold ETF right now is not based on technical analysis, but is instead a bit of a bonus reason to start taking a position in $GLD or similar ETF.
Although the S&P 500 is easily within striking distance of breaking out to a fresh 52-week high any day now, the NASDAQ Composite remains below pivotal resistance of its 50-day moving average and stuck in a 2-month downtrend.
Unless the NASDAQ suddenly gets in gear and breaks out above multiple resistance levels, the tech-heavy index is likely to remain a drag on the broad market in the near to intermediate-term.
As such, our overall bias remains on the short side of the stock market, as well as buying ETFs with a low to zero correlation to the direction of the main stock market indexes.
Commodity ETFs such as $GLD are a great way to hedge your risk of long stock positions in your portfolio right now.
Of course, it's even better when the ETF not only acts as a hedge, but breaks out to rack up solid gains as well.
Right now, $GLD may be just the perfect ETF for both hedging risk and accumulating solid price gains.
Would You Like A Slice Of Leverage With Your Gold?Trading an average daily volume of 7.5 million shares, $GLD is the most popular gold ETF.
However, if you have a small account or are seeking greater potential returns, you might consider buying one of the leveraged gold ETFs instead.
Like $GLD, the Gold Double Long ETF ($DGP) tracks the price of spot gold commodity, but is leveraged to move at double the percentage gain/loss of gold futures.
For even more bang, you may even consider buying $GLDL or $UGLD, both of which are designed to move at three times the price of spot gold.
As a reminder, leveraged ETFs are most suitable for short-term (and sometimes intermediate-term) momentum trading because they often underperform their underlying indexes as holding period increases.
In today's issue of The Wagner Daily, I have provided subscribing members with my exact and preset buy trigger, stop, and target prices for $DGP (rather than $GLD).
As always, I will send a real-time alert to subscribers if/when $DGP meets my preset criteria for swing trade buy entry.
Follow Us: 
![]()
![]()

DISCLAIMER: There is a risk for substantial losses trading securities and commodities. This material is for information purposes only and should not be construed as an offer or solicitation of an offer to buy or sell any securities. Morpheus Trading, LLC (hereinafter "The Company") is not a licensed broker, broker-dealer, market maker, investment banker, investment advisor, analyst or underwriter. This discussion contains forward-looking statements that involve risks and uncertainties. A stock's actual results could differ materially from descriptions given. The companies discussed in this report have not approved any statements made by The Company. Please consult a broker or financial planner before purchasing or selling any securities discussed in The Wagner Daily (hereinafter "The Newsletter"). The Company has not been compensated by any of the companies listed herein, or by their affiliates, agents, officers or employees for the preparation and distribution of any materials in The Newsletter. The Company and/or its affiliates, officers, directors and employees may or may not buy, sell or have positions in the securities discussed in The Newsletter and may profit in the event the shares of the companies discussed in The Newsletter rise or fall in value. Past performance never guarantees future results.
© 2002-2013 Morpheus Trading, LLC
Reproduction without permission is strictly prohibited.