For the second day in a row, the major averages were able to fight off some early morning selling and put together a productive session. While Tuesday's action was more of a chop fest to digest the prior day's advance, Wednesday's reversal off the lows showed some decent buying interest, as the averages pushed to new intraday highs into the close. The small-cap Russell 2000 and S&P Midcap 400 each gained 1.1%. The Nasdaq Composite rallied 1.0% higher. The S&P 500 and Dow Jones Industrial Average rose 0.6% and 0.4% respectively. Most averages closed near the highs of the day, in the top 15% of the day's range.
Total volume increased by just over 1% in the Nasdaq, technically registering a bullish accumulation day. NYSE volume was once again lighter by 1%. Market internals were mild, with advancing volume beating declining volume by 2 to 1 in the NYSE and 1.7 to 1 in the Nasdaq. Overall, it was a decent day for the market.
The daily chart below shows the recent volatility contraction in the iShares Russell 2000 Index (IWM):
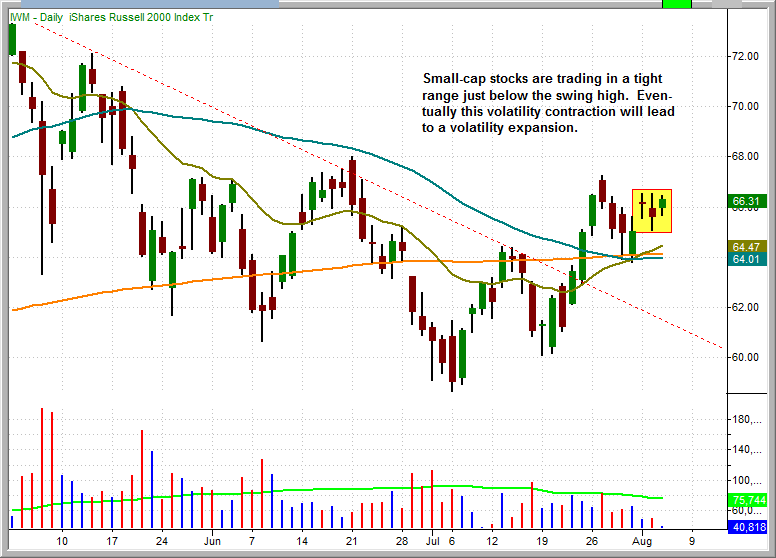
Which way will it go? We often see a false move to one side that gets the crowd leaning in the wrong direction before the real breakout takes place. Other times the breakout comes in the form a strong gap that leaves the crowd in the dust. As of right now we are more inclined to say that this breakout will eventually be resolved to the upside.
Our recent long entry in the Powershares US Dollar Index Bullish (UUP) found big volume support yesterday following a two-bar shakeout below the 200-day moving average:
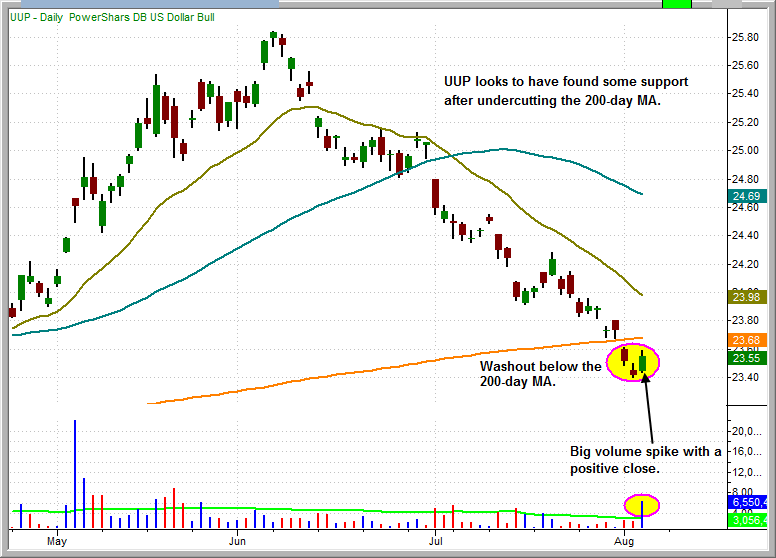
Volume picked up nicely with yesterday's positive close. We'd like to see the price action climb back above the 200-day moving average within the next few days to confirm that the dip below the 200-day MA was just a shakeout.
The weekly chart below shows UUP pulling back into support of the prior consolidation:
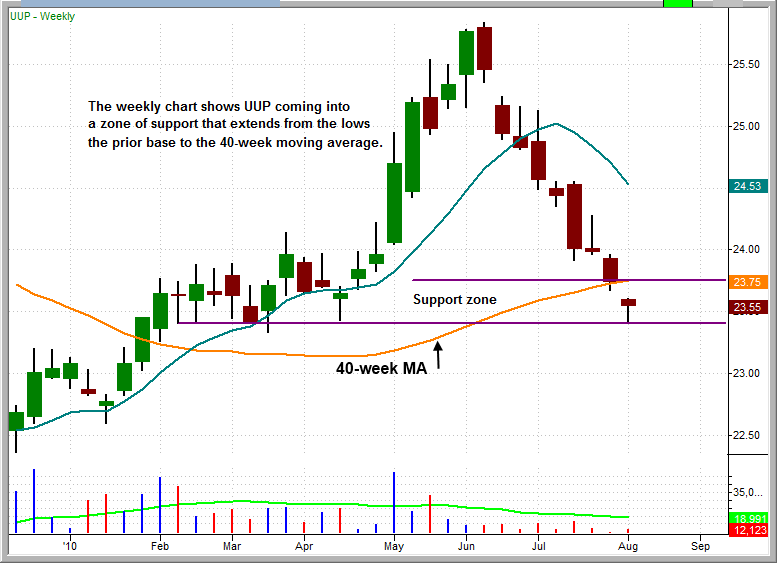
We see a zone of support from the 23.30 to 23.80 area. Those who are not already long can wait for confirmation before entering by allowing UUP to close back above the 200-day (or 40-week) moving average.
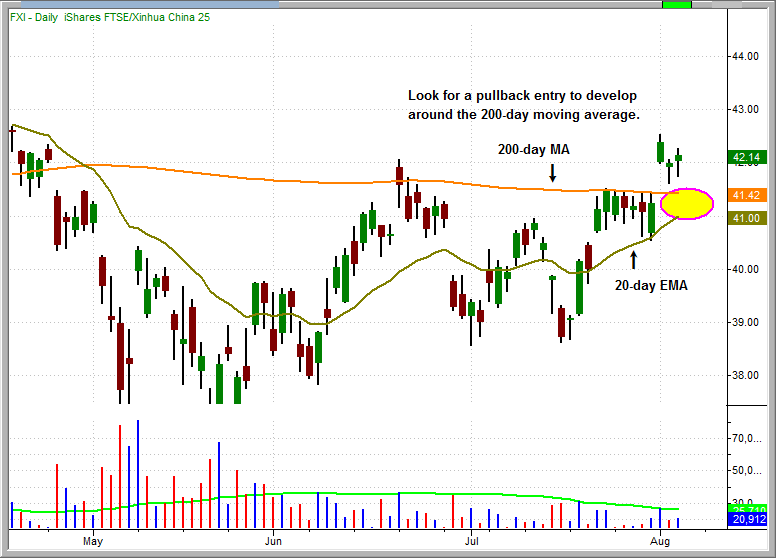
iShares FTSE/Xinhua China 25 (FXI) recently broke out from a tight range and recaptured the 200-day moving average. This is a rather obvious breakout, so the better entry point may be to wait for a pullback to the 200-day moving average with the rising 20-day EMA catching up. The 41.00 - 41.50 area looks to be a decent level of support to establish a low-risk entry point.
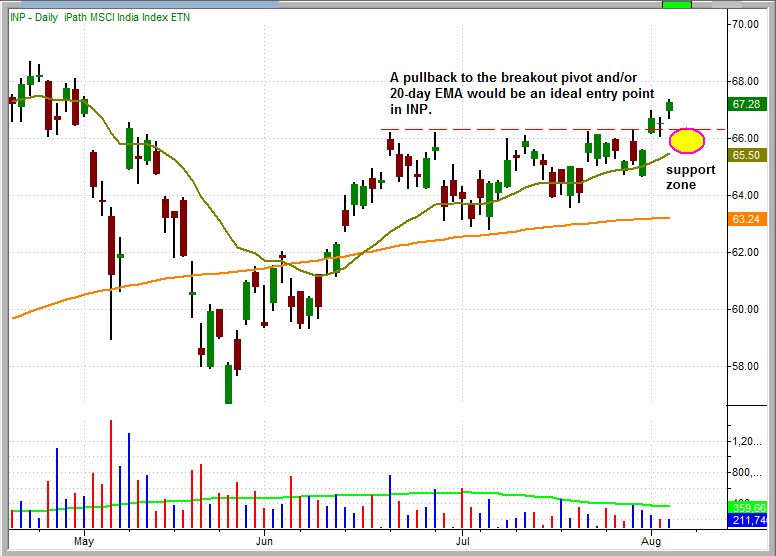
iPath India Index (INP) recently broke out from a tight, five-week range on top of the 200-day moving average. Buying the obvious breakout is tough, especially when market conditions are not ideal. Like FXI above, INP is a low-risk buy setup on a pullback to the breakout pivot and the rising 20-day EMA. Look for support to come in around the 65.50 - 66.00 area.
During the past two days, we have seen these quick morning selloffs that retreat about 1% or so off the intraday high before finding support. These retracements are deep enough to scare off traders who are holding a few longs and have little to no conviction in their positions. Once the market sells off, the trader with no conviction may think that this could be the beginning of a multi-day selloff in the market, so he exits on a whim (panic sell) and takes a small loss to avoid the big loss that is about to come. This panic sell often ends up being right at or very close to the low of the day. So, when the market eventually recovers, the trader who sold near the lows becomes frustrated and must now get back in at much higher prices (if at all). This can go on for a several days, as the trader continues to buy and sell on a whim, each time taking a small loss along the way. Eventually these small losses add up to one big loss, which is what the trader in this scenario was trying to avoid in the first place.
Just about every trader who has been at it for a while has gone through this process at least once. These type of mistakes can easily be corrected by traders if they commit to planning the trade before entering, and reviewing the trade plan (for each position) every night.
On Friday August 6 only an abbreviated version of the Wagner Daily, summarizing open positions, will be published (day 3 of 7 days allowed per year).
| Open ETF positions: Long - TAN, TLT, UNG, UUP Short (including inversely correlated "short ETFs") - GDX |  |
Deron Wagner is the Founder and Head Portfolio Manager of Morpheus Trading Group, a capital management and trader education firm launched in 2001. Wagner is the author of the best-selling book, Trading ETFs: Gaining An Edge With Technical Analysis (Bloomberg Press, August 2008), and also appears in the popular DVD video, Sector Trading Strategies (Marketplace Books, June 2002). He is also co-author of both The Long-Term Day Trader (Career Press, April 2000) and The After-Hours Trader (McGraw Hill, August 2000). Past television appearances include CNBC, ABC, and Yahoo! FinanceVision. Wagner is a frequent guest speaker at various trading and financial conferences around the world, and can be reached by sending e-mail to deron@morpheustrading.com.
DISCLAIMER: There is a risk for substantial losses trading securities and commodities. This material is for information purposes only and should not be construed as an offer or solicitation of an offer to buy or sell any securities. Morpheus Trading, LLC (hereinafter "The Company") is not a licensed broker, broker-dealer, market maker, investment banker, investment advisor, analyst or underwriter. This discussion contains forward-looking statements that involve risks and uncertainties. A stock's actual results could differ materially from descriptions given. The companies discussed in this report have not approved any statements made by The Company. Please consult a broker or financial planner before purchasing or selling any securities discussed in The Wagner Daily (hereinafter "The Newsletter"). The Company has not been compensated by any of the companies listed herein, or by their affiliates, agents, officers or employees for the preparation and distribution of any materials in The Newsletter. The Company and/or its affiliates, officers, directors and employees may or may not buy, sell or have positions in the securities discussed in The Newsletter and may profit in the event the shares of the companies discussed in The Newsletter rise or fall in value. Past performance never guarantees future results.
Charts created by TradeStation (tradestation.com).
© 2002-2010 Morpheus Trading, LLC
Reproduction without permission is strictly prohibited.
Disclosure: Long TAN, Long TLT, Long UNG, Long UUP, Short GDX