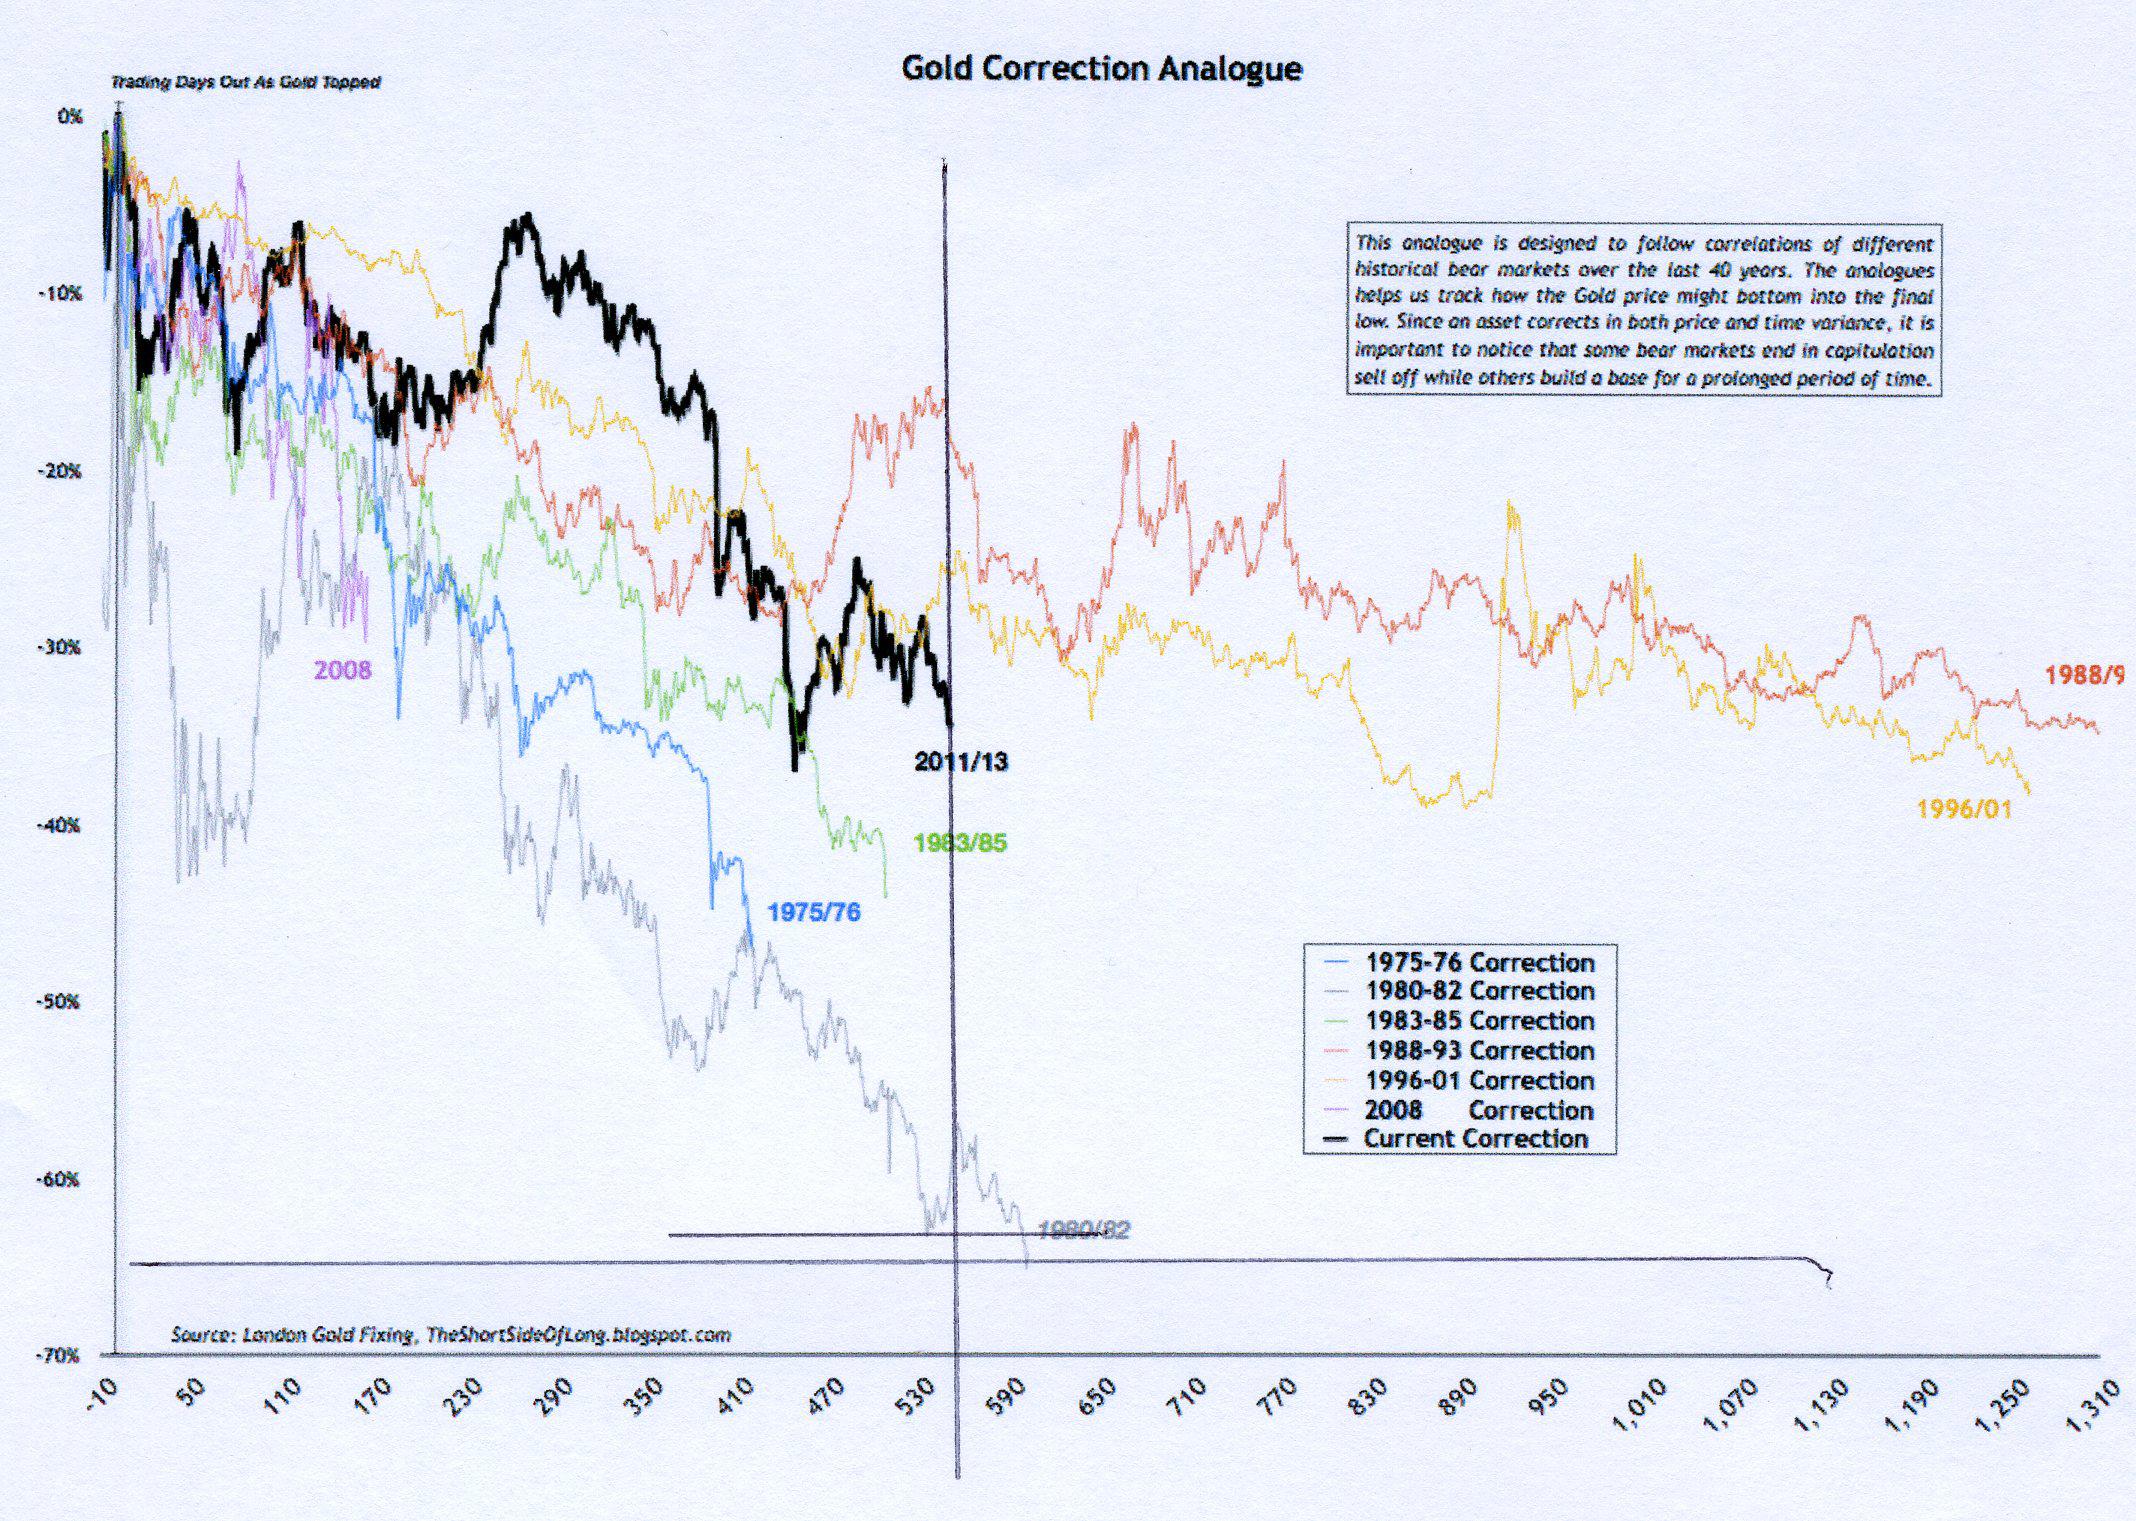
The above chart includes all of the gold bear markets of the past 40 years. I drew some lines on the charts and although my lines are not perfectly perpendicular, it is apparent that the current bear market (shown as the dark black line) has gone on for 550 trading days since the all-time high over $1900 reached in September 2011. This chart is quite revealing on several levels. First, one realizes that when gold bottomed in June 2013, it had fallen about 38%. Comparing this to previous bear markets, it is about right in the middle in regards to severity so far.
When I posted this chart in a previous article, click here, the author had removed the 1980-82 bear market, feeling it was an outlier. He felt that because gold had gotten quite frothy and gone parabolic prior to the 1980 top, that one would expect a greater than normal correction, and without such a parabolic move at the top, no other bear market can be compared to the 1980-82 bear market. I feel his argument has merit and makes sense.
When A Gold Bear Market Lasts 550 Trading Days, New Lows Are Minimal, Based On Historical Data
However, I am quite comfortable that the current bear market of 2011-13 should not suffer a further steep decline because anytime a bear market reaches 550 trading days in length, further drops are minimal. This conclusion is based on past experience which may not repeat in the future, but odds do not favor a significant decline occurring now or in the future for the current bear market. Such a decline that is envisioned for 2014, by most prognosticators, if it does occur, it would be a black swan event, a complete outlier. Not usually a smart decision to bet on the extreme case as the extreme case only occurs rarely. Those positioned for further weakness and a move to $1100, $1000 or lower in gold, are going very much against the odds. Based on technicals alone, I do not see a significant selloff in gold in 2014 and at worst feel that we will go sideways in a range before ultimately resolving to the upside with my 2014 target of $1450 to $1500 and more likely $1600 or higher. The trading range that I see is $1200 to $1400 or at worst, $1150 to $1450, but the ultimate resolution should be higher.
On the above chart, I drew a vertical line down from the end of the black line of 2011-13, and it shows we have reached at least 550 trading days in the current bear market. Now look where the vertical line intersects the various bear market lines and see what implications can be drawn.
Well, first of all, the 2008 bear market (violet line) lasted 8 months and only fell 30%. We have far exceeded that in degree and time. When looking at the 1975-76 bear market (blue line on the chart), it fell 48%, about ten percent more than the current 38% drop of the present bear market. However, it ended in less than 420 trading days. Likewise the 1983-85 bear market (green line), only exceeded the current bear market at the very end, falling nearly 45% at the bottom, but was exhausted in just over 500 days. The next bear market is length was the horrific 1980-82 bear market (grey line). In about 535 days it had fallen 63%, but then rallied and when it finally bottomed around trading day 600, it only fell another 2% to a 65% overall drop. Likewise, now that the current bear market of 2011-13 has gone on for 550 days, I feel that any new low should not exceed more than a couple percent below the June 2013 low of $1180. I feel that the worst case scenario puts the bottom around $1150 or $1155. There is a Fibonacci retracement level on the long term chart that targets $1156 if I recall correctly.
The two long 5 year bear markets of 1996-01 (yellow line) and 1988-93 (red line) never quite reached the 40% retracement level. Also, once they had lasted 550 days, there were numerous rallies and selloffs for the final two years. Gold basically remained in a range. If gold does not significantly rally in 2014, the worst case scenario that I envision, based again on past experience, is that gold remains in a sideways pattern, bordered by $1200 to $1400 or $1150 to $1450, while waiting for an upside breakout.
Disclaimer:
The thoughts and opinions in this article, along with all stock talk posts made by Robert Edwards, are my own. I am merely giving my interpretation of market moves as I see them. I am sharing what I am doing in my own trading. Sometimes I am correct, while other times I am wrong. They are not trading recommendations, but just another opinion that one may consider as one does their own due diligence.
Disclosure: I am long GDX.
Additional disclosure: Also long NUGT, NEM and gold futures