
For those traders playing the triple leveraged bullish Biotech ETF (LABU), you need to study the above weekly chart of XBI, the ETF that LABU tracks. When the year began, XBI was sitting at $70.20. There was a gap down when the year began, and the carnage has continued almost unabated for four painful weeks. During this past week, although the DOW was able to rise over 2%, XBI dropped 8.6%. For the first 4 weeks of 2016, the DOW is down 5.7% while XBI is down 28.0%. Since the July 2015 top of $90.86, to Friday's close of $50.55, XBI has fallen 44.4% while the Dow has only fallen about 7.4%. Investors have been fleeing out of the volatile and more speculative high flying biotech sector. Being made up of the younger, smaller and more speculative biotech names, you would expect that XBI would outperform to the upside during good times, but fall much harder during bad times, making for heightened volatility along the way. When you then add triple leverage by playing LABU, you have volatility on steroids.
When the year began, LABU was trading at $21.10 compared to the XBI price of $70.20. LABU ended Friday at $7.15, a drop of 66.1%. XBI closed at $50.55, a drop of 28.0%. Since LABU is triple leveraged, if XBI falls 28%, then LABU should be down 84%. LABU should be trading at $3.38. With slippage, it should be around $3.00. To explain the discrepancy, I can only assume that on December 21, 2015, LABU was already trading at a significant discount to where it should have been otherwise trading, based on very negative sentiment. Am I right about my theory? Well, in July 2015, XBI topped out at $90.86. So a fall from there to the $70.20 level by the end of 2015, is a drop of 22.7%. Compare that with the July 2015 high in LABU of $59.82. By the end of the year, LABU fell to $21.10, a fall of 64.7%. If you multiply 22.7 times 3 you get 68.1. LABU by the end of the year should have been down 68.1% but it was only down 64.7%. Instead of underperforming, LABU was outperforming slightly going into the end of the year. That trend of outperformance has continued even stronger these past 4 weeks in 2016. This tells me that someone, supposedly "smart money" must be buying LABU and keeping it from falling as low as it would otherwise. Someone must know something. The above calculations do not consider slippage so LABU should be just under $3 if you figure in slippage during the last 4 weeks, but add in slippage since the July 2015 high, and LABU should be trading around $2.25 to $2.50.
Since LABU is recalculated on a daily basis, everything that occurred before does not matter. Therefore, there is no worry that suddenly you will wake up and LABU will fall out of bed. It will stay overpriced going forward. What this tells me, is that each day, someone must be buying LABU on the close and adding a few pennies to what it should otherwise be trading at. It shows that LABU is well subscribed and supported. This should not be shocking since XBI had a whale of a bull run from August 2011, of $17.84, to the July 2015 high of $90.86. When the current correction ends, expect another move back towards $90.86 in XBI and likely far beyond.
The bottom could come sooner rather than later, as XBI recently hit a low of $48.78. There should be support come in at $48, and again at $45. Looking at the weekly, you can see major support around the $38 to $40 area and I seriously doubt that area will be tested. A 50% correction from the $90.86 top, would project a drop to $45.43. From the Friday close of $50.55, that is a drop of $5.12, or about 10%. In LABU, that would project a risk of about 30% from the Friday close of $7.15, down to $5. Add in some slippage and the risk of maybe down to $4.75 to $4.80.
Now for those trading LABU, take a peak at the daily chart:
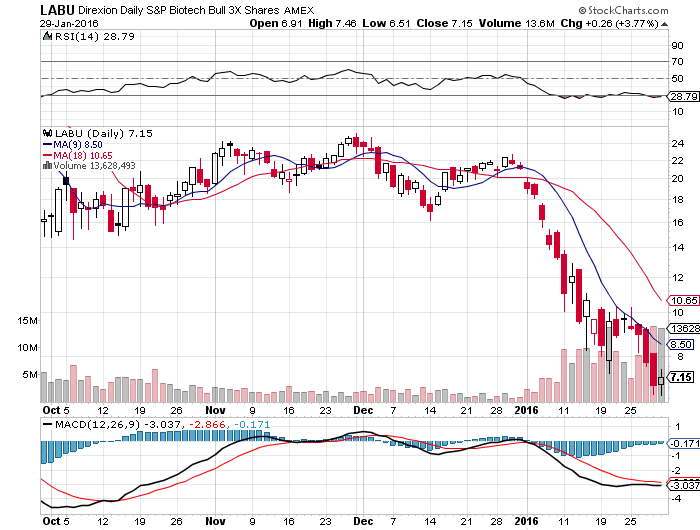
We have an easy target up to the 9 day moving average blue line, sitting now at $8.50. I expect that we should rally to that level early next week, with an outside chance we work up towards the 18 day moving average sitting at $10.65 but should fall to about $10.00. If we can close above $8.50, the next target is $10.00. If we touch but cannot close decisively above $8.50, expect to see a retest of the lows down towards the $6.20 to $6.30 target area I have been talking about for awhile, or down towards the $4.80 to $5.00 area if things get really nasty. In any case, below $7.50 down to around $5 or just below, all dips should be a buy. Just unload half of your position on rallies and play aggressively. If XBI ultimately falls back to the $38 support level from early 2014, that would be a drop of 25% in XBI, or a drop of 75% in LABU down to $1.79, and with slippage maybe $1.50. But for those you are trading LABU, you need not panic because LABU is extremely oversold and should be bouncier and bouncier the lower we go. It is quite possible that with the global stock market surge from Friday, the DOW and S&P could have already bottomed for awhile, and XBI and LABU could have also. That means that Friday's low of $6.51 could have been the bottom. On Friday, I bought LABU at $6.71, to add to my higher shares in the $8.40s. Considering the drop that we have seen, I am very happy with my average price right now. For those with higher shares, adding on dips while dumping half or more on rallies should allow for lowering of your price to a point to where a breakeven price can eventually be achieved. A great majority of the weakness (and risk) has already been realized, so it should be much easier trading LABU going forward.
Disclaimer:
The thoughts and opinions in this article, along with all STOCKTALK posts made by Robert Edwards, are my own. I am merely giving my interpretation of market moves as I see them. I am sharing what I am doing in my own trading. Sometimes I am correct, while other times I am wrong. They are not trading recommendations, but just another opinion that one may consider as one does their own due diligence.