In the middle of December 2015, when natural gas futures hit a low of $1.684 per mmBTU, we hit prices not seen since February 1999. Well, this week natural gas prices in the nearby April futures contract made a new low. We are now at the lowest prices in 20 years. Yes, you have to go back to 1996 to see natural gas prices this low. Now for the all-time low price of natural gas, that would be at $1.02, back in the early 1990s. But when you adjust for inflation, when we dropped below the mid $1.70s last December, we saw the lowest relative futures prices ever. With the drop off this week, that record low relative price has been broken again. As a contrarian, I am very happy to buy natural gas at all-time lows, even if it is inflation adjusted all-time lows.
Initially I had a downside target of $1.75 but when that level was broached, a projection of $1.65 was made. With that level being taken out yesterday, the next stop is $1.50, for no other reason than the fact that it is a nice round number. If $1.60 does not cause a significant short-covering rally, surely $1.50 will. As I type now in the pre-market of Friday, April 4, 2016, a few minutes ago a low of $1.611 was scored.
If you want to check on the prices natural gas traded back in the 1990s, click here. Change the year to any year from 1989 to 2014 to see where natural gas traded. Back in January 1991 the all-time low of $1.02. However, from that low natural gas bounced to a high of nearly $2.60 by October of that year. By early 1993, another dip to the low $1.20s was scored. However, by April 1993, priced bounced to the mid $2.70s. But in June 1993 prices dipped to the low $1.80s, bounced to nearly $2.50 by August 1993, but dipped again to the mid $1.90s by September 1993. Prices then advanced to a late January 1994 high of just above $2.70. However, just two months later prices were fighting to stay above $1.90. Then in August and September 1994, prices dipped to just under $1.50. Prices bounced back towards $2.00 but in January 1995, the low of $1.35 was seen. That would turn out to be a major long-term low mark, as we have not seen a price lower than that since. Prices could not get much above $1.80 for several months after that, but finally in December 1995, prices surged to nearly $3.80. But by January 1996, prices dipped just below $2.00 only to bounce to above $2.90 by June 1996. Then a dip to the low $1.80s happened in September 1996. Only to see another bounce in December 1996 to above $4.50. Surprisingly just 2 months later, in February 1997, prices dropped to just under $1.80. But by late September 1997, a high of $3.50 was seen. In October 1997 prices hit $3.80. But by early 1998, we were back to bouncing off the $2.00 level. Finally in August 1998, the low of about $1.65 was seen. But a month later prices hit a high of the mid $2.50s and above $2.60 in November 1998. In early February 1999 prices dipped just under $1.80, but bounced to a high in August 1999 of above $3.00. Above $3.20 was seen in October 1999. The year 2000 was a remarkable year where prices climbed steadily before exploding to over $10.00 by December 2000.
I have covered the 1990s and I hope you can see from that action, how bouncy natural gas can be once a bottom is seen. It should give the bulls some hope that all is not lost. Things will get better. In fact, if you look at the upcoming forecast prices for natural gas found here, you will see that from an expected average price in February 2016 of $1.88, the March 2016 price should average $2.02 with an error of plus or minus 28 cents. We are below the projected low already. By April prices should average $2.35 and by May projections are for prices of $2.58.
For the latest government EIA report, dated Feb. 9th, click here. A new report will be coming out on Tuesday, March 8th. Back then they were forecasting an average price of $2.64 for 2016, with prices possibly hitting $3.00 by December 2016. It will be curious to see if the forecast price is lowered in next week's report.
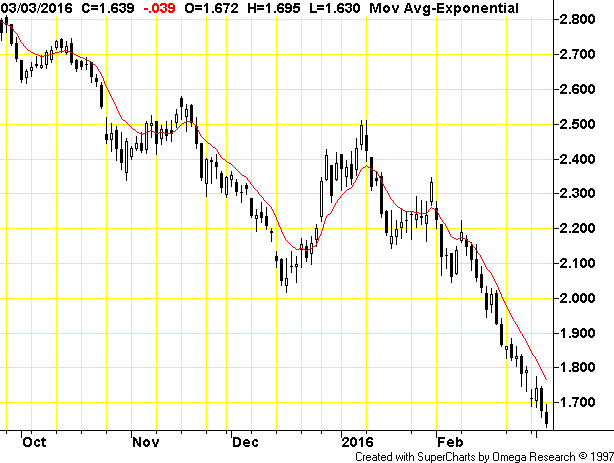
In the meantime, I have begun heavily buying natural gas futures, especially when a new low is scored. Like clockwork, prices bounce but then keep making another new low. At some point very soon, we should bottom and start a more sustained rally. Before I end, I will post the current daily April Natural Gas chart through yesterday's close. You can see below how natural gas has fallen straight down for 4 weeks. We could continue down for another week towards $1.50, but that should be the worst case scenario. If we don't fall apart over the weekend, today could be the low.
Disclaimer:
The thoughts and opinions in this article, along with all STOCKTALK posts made by Robert Edwards, are my own. I am merely giving my interpretation of market moves as I see them. I am sharing what I am doing in my own trading. Sometimes I am correct, while other times I am wrong. They are not trading recommendations, but just another opinion that one may consider as one does their own due diligence.