Individual stock cycles in price and time are the building blocks of major market index cycles. Historically it has been more effective to study stock market cycles using major market indexes as opposed to individual stocks. More recently, since the Federal Reserve has taken up their third mandate mantra of manipulating global markets into a “virtuous” inflationary circle for financial assets, questionable activity in the futures and options markets have distorted the major developed country indexes.
Professional and individual investors and traders are attributing recent index behavior to the Fed’s new third mandate, and the unfathomably deep pools of capital that are at their discretion to trigger inflation in financial assets. Commodity and oil shares have joined the global “virtuous” inflationary drum circle. Meanwhile, individual stocks, such as Microsoft (MSFT), Intel (INTC), Nestle (OTCPK:NSRGY), Coca Cola Co. (KO), China Telecom (CHA), and many other individual shares are tracking the Wall cycle targets in price and time with far greater predictability than the major indexes.
The object of the monetary beat of the virtuous drum circle is to stoke the inflationary fires at the center of the global economic engine, thus preventing the feared long wave winter deflationary apocalypse. Growing addicted to the monetary injections, investors in the commodity and oil shares have grown hypnotized by the beat of the QE2 drum, dancing faster and faster around the virtuous circle as global commodity inflation heats up.
Food inflation fed revolutions are enveloping the emerging world, so maybe the “virtuous” circle of inflation is a success, depending how you measure success. “Politics destroys the money world”, as the late PQ Wall was fond of saying. Now the money world is returning the favor and setting fire to unstable political regimes around the globe. Who is next? Saudi Arabia, Iran, China? Unfortunately, the law of unintended consequences is alive and well, and Murphy is fluent in all languages.
Of course, we will likely never know for sure the full story behind the dark pools bidding the major index futures ever higher, but there does appear to be some questionable activity at important market index junctures. The dark pools appear to be bottomless, or at least a few $trillion plus, if the world really gets in a bind. The indexes regularly rally to and through key Fibonacci and Gann targets, blowing out the shorts, continuing the march of the global investor pilgrimage into the virtuous inflationary drum circle, in a trance and in pursuit of investor’s Nirvana.
Sources have suggested that the Fed has their own Gann and Fibonacci traders, and they enjoy taking out the key resistance targets, spending billions to make sure key support holds. Chairman Bernanke has suggested he will do what is required to insure the mesmerizing dance to the beat of the inflationary drum circle continues. Therefore, turning attention to the cycles of the individual stocks is reasonable, since that appears to be less subject to the beat of the QE2 drum and the virtuous circle dance around the fires of global commodity inflation.
The non-commodity stocks are still subject to that old corrective market force akin to gravity, which sees to it that stocks put in regular cycle lows. Microsoft is a case in point. Look at the charts below, and their accompanying LWD drill-down Fibonacci grids. If you have not been paying attention to the Fibonacci drill-down grids and the Wall cycle forecaster, you have been investing blindfolded.
Observe the Microsoft Level 1 Fibonacci grid, which uses the 2000 high and the 2009 low to generate the Fibonacci grid. The Level 2 grids on either side of the inverse golden target of $27.40 are also included. Observe that the high in 2008 tagged the golden ratio in the Level 1 grid, even though the low in the grid had yet to be printed. The July 1, 2010 low tagged the 23.6% target in the Level 1 grid. Other grid targets also produced important turns, such as the inverse golden in the Level 2 grid in January and April 2010. The Level 1 grid is clearly a hot grid for Microsoft and warrants watching.

At LongWaveDynamics.com price is always a big part of the cycle story. However, time helps complete the picture in the study of cycles. The low of July 1 in MSFT, along with the S&P 500, was an important Wall cycle low. What the Wall cycle date forecaster is telling us is the MSFT is once again looking for a Wall cycle bottom, and it is trying to bottom without breaking hard below the 38.2% inverse golden ratio in the Level 1 grid target of $27.40.
It closed below this target on Friday, February 11, and needs to get back over it next week, or it will have to drop down and test the 23.6% target to bottom the Wall cycle in MSFT. If the indexes finally roll over to end their Wall cycle, MSFT will be hard pressed to not be forced into the Level 2 grid between $22.41 and $27.40. The golden ratio is always the most interesting target in any grid, so keep an eye on $25.49, which is the 61.8% target in the Level 2 Fibonacci grid of $22.41 to $27.40. Microsoft is in Wall cycle #4 of the current Kitchin (business) cycle, which began in March 2009. The chart above suggests this Wall cycle is attempting to put in a bottom. The LWD Wall cycle bottom forecaster generates specific target dates for a bottom for the Wall cycle in Microsoft.
A quick LWD method analysis for Coca Cola Co. (KO) is presented below. The top chart demonstrates how the Level 1 high comes from the 1998 high and the Level 1 low comes from the 2003 low. The chart demonstrate that both the December 2010 high and the January 2011 low were close to the Level 2 golden ratio target on either side of the 76.4% Level 1 Fibonacci target. The January low was within one day of the 50% Wall cycle extension target. This makes the January low a possible important Wall cycle low. KO appears to have bottomed in the Wall cycle ahead of the S&P 500 index.

Intel is an excellent example of the powerful price and time Fibonacci cycle forces at work on an individual stock. The Level 1 uses the 2000 high at $64.12 and the 2002 low at $10.99. If you are invested in or trading Intel you will find it relevant that the April 2010 rally was stopped dead in its tracks, 10 cents shy of the Level 1 23.6% target of $23.53. At the September 2010 low, Intel was testing the Level 2 golden ratio at $17.60. That January 7, 2011 low tested and briefly dropped under the inverse golden 38.2% target in the Level 2 grid, and it has now rallied up to the golden ratio 61.8% target at $21.70.
Intel looks like it may have bottomed its Wall cycle on January 7, 2011, which was the exact target date on the Wall cycle forecaster from the August 31, 2010 low for 9.016% short of the ideal target date. If you are investing in or trading Intel (INTC) without the LWD method of tracking individual stocks and indexes in price and time, you are doing so in the dark.

Presented above are just a few individual large cap U.S. stocks. Every index and individual stock around the globe can be tracked with the LWD methods in price and time. Siemens (SI) is currently trying to hold on to the 85.4% target in its Level 1 grid. Nestle is currently testing support at the same 85.4% target in its Level 1 grid. These shares have had quite a run and could face major resistance as European austerity appears to be the path out of the European debt crisis that will reach the next stage in 2011. Tracking their cycles is advised. 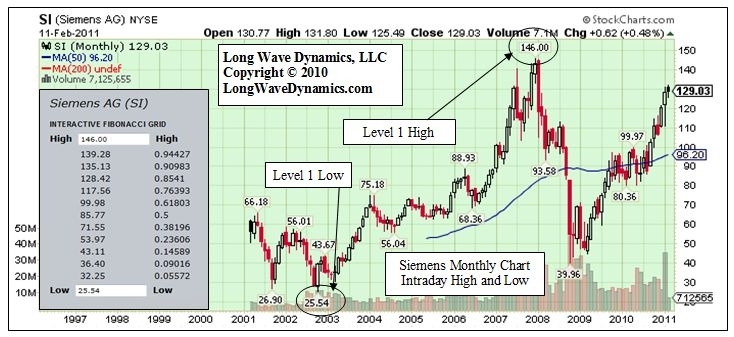

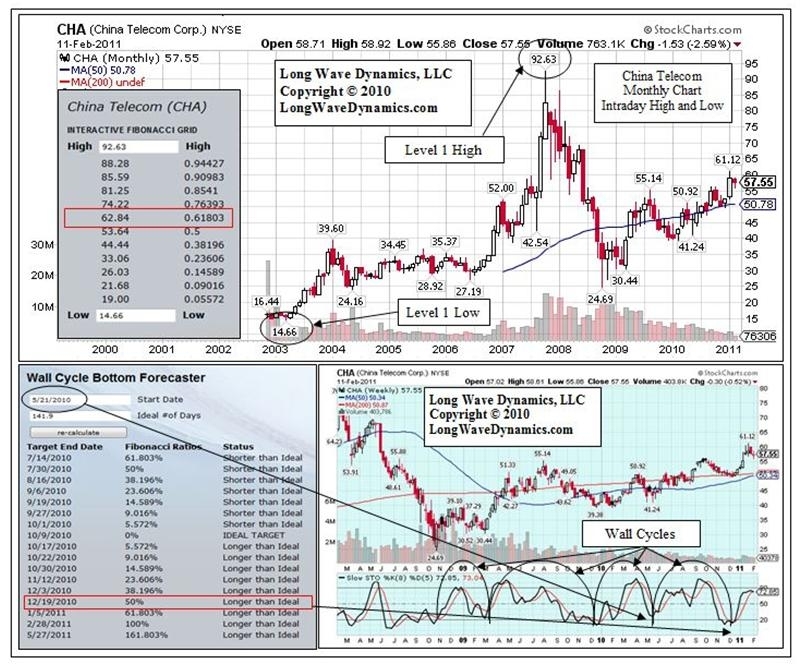
China Telecom Corp. (CHA) looks like it put in a Wall cycle low on December 19, 2010, note that was an exact 50% Wall cycle extension from the low on May 21, 2010. CHA is now approaching the golden ratio in the Level 1 Fibonacci grid at $62.84. It must get over this important Fibonacci target to keep the current Wall cycle rally going. The golden ratios in the Level 1 and Level 2 grids often prove to produce Wall cycle or Quarter Wall cycle corrections that shake up investor confidence and test important Fibonacci support before launching the next cycle.
The Fibonacci drill-down grids and ideal cycles in price and time reflect the fields of human action in the global economy that produce cycles in the large cap stocks. It is a global phenomena. You will see these cycles in price and time in almost all stocks. These are the building blocks of the major global index cycles. Cycles in price and time are natural laws that can briefly be manipulated with monetary and fiscal policy in pursuit of virtuous circles. However, regardless of such measures and how well intended they may be, the ebb and flow of the global economy and financial markets will take their natural course in price and in due time.
Investors and traders ignore the cycles in price and time in individual stocks and indexes at their peril. Cycles in individual stocks produce a refreshing amazement at the human action that produces them, in an increasingly financially jaded world. Cycles are a delight to study and observe as they cut their own virtuous circles to the drumbeats of global human action, and not the Keynesian manipulators.
We are only just beginning to understand the virtuous circles of human freedom in action that produce the global cycles in price and time in individual stocks and major indexes. Manipulated indexes in pursuit of virtuous circles of global inflation are just a passing craze that will end as the great global long wave winter cycle of human action turns full circle. In the meantime, tracking the cycles in the individual shares can be rewarding for investors and traders that enjoy the value of cycle analysis.
Disclosure: I have no positions in any stocks mentioned, and no plans to initiate any positions within the next 72 hours.