[May 23, 2013]
A significant sell signal was completed today by the S&P 500. I follow a 'Trend Exhaustion' system that uses the Setup, Sequential and Combo technical indicators.
Some amazing calls made by these indicators have been described in my article: Trend Exhaustion Market Timing Excel Spreadsheet. Detailed descriptions of the indicators and other information is also found on my Tom Demark page. In this article I will assume you have a basic understanding of these indicators. I also highly recommend the book, "Demark Indicators" by Jason Perl.
The spreadsheet can analyze the Setup, Sequential and Combo indicators on 3 time frames - Monthly, Weekly, and Daily. Looking back at market history, major sell signals have occurred when the stock market has advanced to a point where all 3 timeframes are recording sell signals. This signifies the market is way overbought and has advanced too far too fast.
There can be no question the S&P 500 is overbought and overbullish. By many simple technical analysis methods (Bollinger Bands, MACD) the market is extremely extended, even approaching parabolic. Parabolic moves don't end well. Bullishness is high, with the % of Bulls far outnumbering the % Bears in investor polls such as AAII. The latest crowd sentiment poll compiled by Ned Davis Research has reached 70.9, rivaling the most extreme readings in this indicator's history - see the Forbes article Sentiment Blow Out.
The advantage of using Setup, Sequential and Combo indicators instead of conventional trend-following methods is that you can buy into weakness and sell into strength. Operating against the trend is often difficult because it contradicts human nature. However, there are distinct advantages to doing so, and these indicators are designed specifically to accomplish this goal.
Let's evaluate the market using the Trend Exhaustion Spreadsheet:
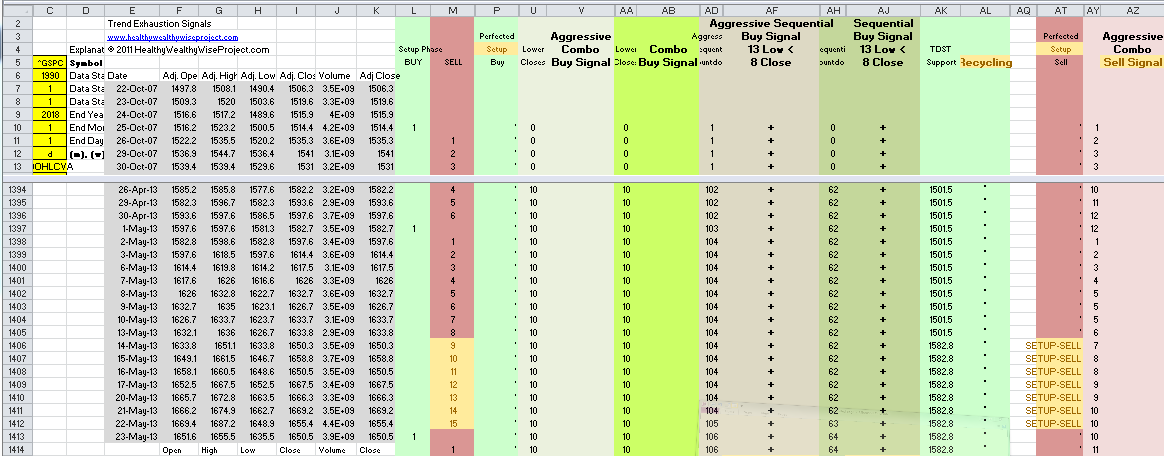
Here is an image of the S&P 500 on a Monthly timeframe, showing an 'Aggressive Sequential' sell signal at the end of April 2013. The Sequential sell Signal is shown in cell BJ286.

After a monthly signal is given, I like to wait on a Weekly, then Daily signal to confirm the major trend is at an end. On a Weekly timeframe, The S&P 500 reached a Combo sell Signal the week of May 6th, 2013. Both the 'Aggressive' and standard Combo signals fired, as shown in cells AZ1224 and BF1224.

For higher confirmation the market has completed it's upward trajectory, we like to see a Daily signal follow the Monthly and Weekly. This occurred today, May 23, 2013, when the S&P 500 completed a 15-day Setup phase (Setups are a minimum of 9 days. The signal came today when today's close failed to exceed the close of 4 days ago). The Daily signal is shown in cell M1412 below.
Today I 'hedged' the value of my stock portfolio by purchasing several etf's which move inverse to the S&P 500. I purchased SDS at $39.11 (2X inverse) and SPXU at $23.07 (3X inverse). I was at a low % of stocks in my portfolio so the hedges are relatively small.
Risk Management: Tom Demark describes a method to establish a risk level of when to get out of this trade if it goes against you, by adding the True Range of the highest high during the Setup or Countdown phase of the signal. On the daily signal the highest high was 1687.2 yesterday, May 22nd. The True Range yesterday (High - Low) was 38.3. Adding 38.3 to 1687.2 gives a risk level of 1725.5. I would get out of the trade if the S&P 500 continues higher and closes above 1725.5.
You can purchase the Trend Exhaustion Stock Market Spreadsheet thru my Research Offers page.
Things I worry about:
-I don't know what Tom Demark thinks of the market right now. He is very hard to track since he is under contract to some of the largest hedge funds in the world - ie. SAC Capital. He will often however give interviews on CNBC or Bloomberg TV and generally gives very direct buy/sell advice when interviewed. Demark has pinpointed practically every significant market junction in public since 2009, but did have a big miss by calling a Sell on the S&P 500 in January of this year - too early.
-With Ben Bernanke flooding the market with money thru QE programs I worry that many systems won't work in this environment. However this Trend Exhaustion is still around after 30 years of development and has made unbelievably accurate calls (my spreadsheet can look at the S&P 500 back to the 1980's)
-The Daily Sell signal described above could continue into a Combo or Sequential Signal, meaning I'm a little early on the exact market turn.
Disclaimer:
-Tom Demark and Market Studies, Inc. is not associated with this website or any product offered herein.
-This article is not intended as investment advice. Do your own due diligence.
Disclosure: I am short SPY.