XOM CALL RATIO BACKSPREAD
Exxon Mobile (XOM) reports earnings on April 29, 2010 and the following chart shows it in an uptrend:
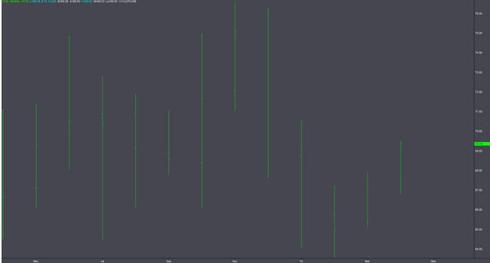
Figure 1 Monthly XOM Chart from Tradestation.com
Oil is currently trading above $80 as this is considered a bullish factor for a stock in the energy sector. Technically, the first resistance on monthly chart is $76.50. Also, a proprietary indicator has been at a very low level for 3 continuous weeks ending April 23, 2010.
Typically, explosive moves occur after this has happened, but the direction of the move is not forecast. It is the hypothesis that based on fundamental and technical factors that this move will most probably be resolved in higher prices. Currently XOM has a trailing P/E of 17.4 but its forward P/E is just 9.5 and it has a PEG Ratio of .76 (from Yahoo finance April 26, 2010), where as the trailing P/E of the SP 500 is 22.
Below is the price of XOM options when the stock price was trading at approximately $69.30 on April 26, 2010, along with the option Greeks.
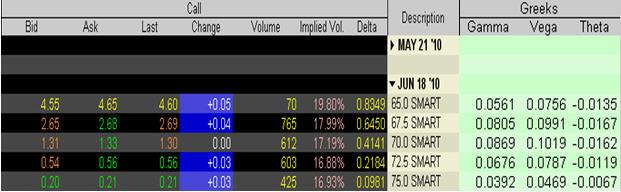
Table 1 Data from Interactive Brokers
The strategy will focus on a bullish call ratio spread in June 2010 options. This involves selling one $67.5 call and buying three $72.5 calls per spread. The bid price of the $67.5 calls is $2.65 and the ask price of the $72.5 call is $0.56. Putting on one spread would result in a price to the account of ( 3 * $0.56 ) - $2.65 = - $0.97 (credit spread). This would put the maximum risk per spread at $403.
The Delta of the position is (3 * .218) – .645 = .009 which is practically delta neutral. The Position is long Gamma .122 and Vega .137, and negative Theta -.019. Vega is considered low risk to fall more since implied volatility (IV) in XOM options is already near a one year low and the $67.5 strike has higher IV than the $72.5 strike by over a point.
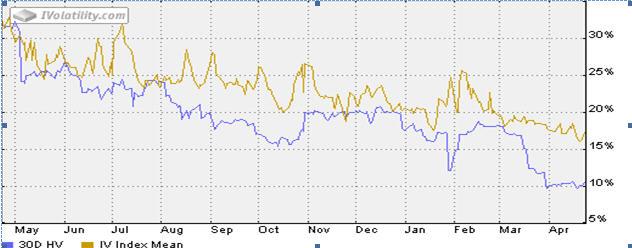
Figure 2 Historical & Implied Volatility from ivolatility.com
If XOM trades to $76.5 by mid May then the $67.5 strike should be priced at approximately $9.10-$9.20 and the $72.5 strike $4.10-$4.20 based upon intrinsic value (which could be higher if IV rises). This leaves the spread at a price of $3.4 which means a profit of just under $440 per spread not including commissions. This is about a 1:1 reward to total risk ratio. However if XOM where to spike up to $80 a share then the spread would be about $10 for a profit of just under $1100 a spread. For a reward : risk of 2.75. If a trader wants more potential risk and upside a short $65 strike long 72.5 strike, in a 1:4 ratio, could be taken.
This option position has unlimited upside profit potential, and if XOM had a disaster the spread would still make a profit if the share price settled under the $67.5 strike in June. The benefit of this position is seen as a higher possibility of a larger move of higher prices in XOM, and because of the current IV smile in June XOM options favors buying OTM calls. The June expiration month was chosen over May because of time and IV skew being more favorable. This looks like a great low risk way to take a position in XOM’s earnings release with most risk centered on Vega and Theta.
Disclosure: The author currently has stock and/or option positions in XOM.
Disclosure: Positions in XOM stock and/or options