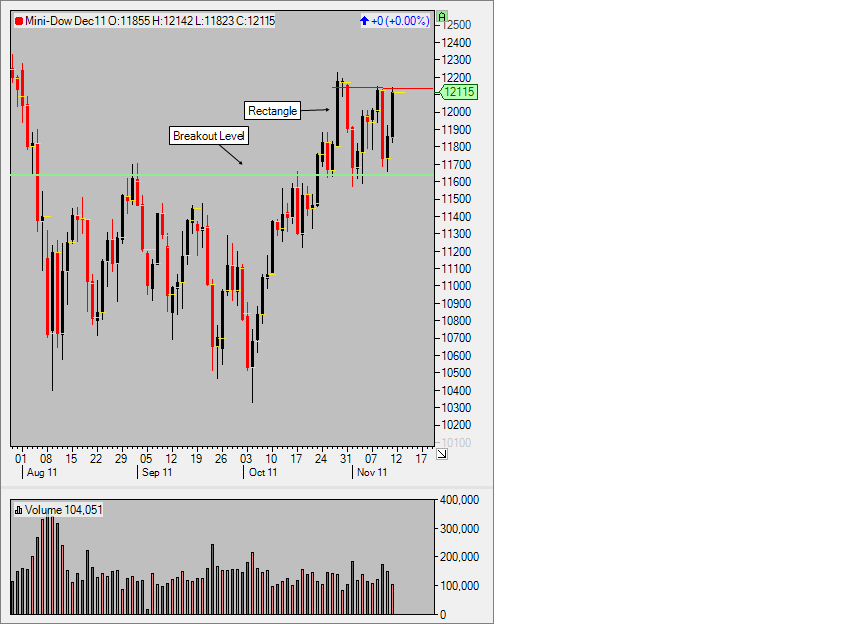
- On the daily chart, we formed a rectangle, around the breakout level, of the consolidation formation, formed between August and October. An upside breakout, would imply a minimum profit objective, of 12,653. A rectangle is a consolidation or reversal chart pattern.
- At 12,110, we reached the minimum profit objective, of the head and shoulders formation, that formed on the one hour chart, between November 9th and November 11th. A head and shoulders pattern is the most reliable chart formation.
- We could spend some time around the 12,000 consolidating the gains. We'll see how the market opens and trades Monday and Tuesday.
The information contained in this paper is based on or derived from information generally available to the public from sources believed to be reliable. No representation or warranty is made or implied that it is accurate or complete. Any opinions expressed in this paper are subject to change without notice. This paper has been prepared solely for information purposes and if so decided, for private circulation and does not constitute any solicitation to buy or sell any instrument, or to engage in any trading strategy.