The Indicator Review aggregates the primary economic reports released each month/quarter in one place and arranges them in five categories: overall economy, real estate, business operations, business sales, and consumers. The review is updated weekly (usually by Sunday) and is primarily for students and investors who need to catch up on what happened in the market. Any reported errors can be messaged to me or left in the comments. A tutorial on reading indicators can be found on my SA instablog post. You can also download the report as a double-sided PDF.
New Reports: Consumer Confidence, GDP, Personal Income and Outlays
OVERALL ECONOMY
GDP
GDP up to $15.99T, Personal consumption up to $10.91T, Private investment up to $2.69T, Government spending up to $2.88T, Trade deficit up to $0.46T.
Q2 non-residential investment up 8.4% vs. Q1 up 1.6%. Q2 residential investment up 7.2% vs. Q1 down 5.3%.
Q2 real exports up 10.1% and imports up 11.0% vs. Q1 down 9.2% and up 2.2%, respectively.
Employment Situation
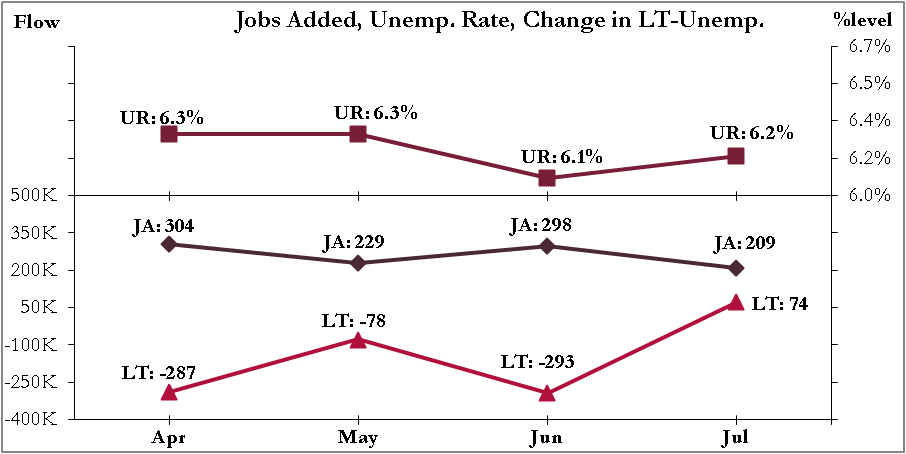
Long Term Unemployment up slightly to 32.9% of unemployed.
Employment up in Professional and business services, Manufacturing, Retail trade, Construction, Social assistance, and Mining, ordered by magnitude. Little change in other industries including Leisure and hospitality, Wholesale trade, Transportation and warehousing, Information, Financial activities, and Government.
Consumer Price Index
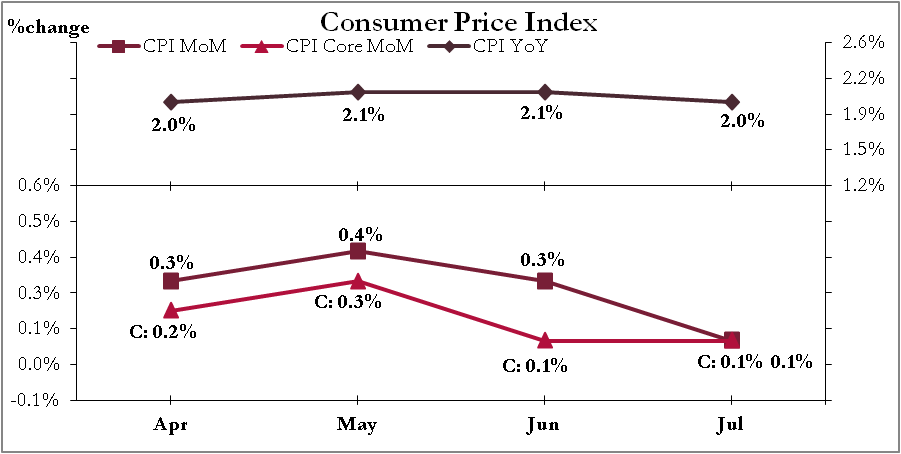
Energy index down 0.3% and Food index up 0.4%. For energy: Electricity (0.3%), Natural gas (-0.4%), Fuel (-0.7%), Gasoline (-0.3%).
CPI Core components: Commodities less food and energy commodities (0.0%), Services less energy services (0.1%) with sub-indices: Shelter (0.3%), Transportation (-0.7%), Medical care (0.1%).
Producer Price Index
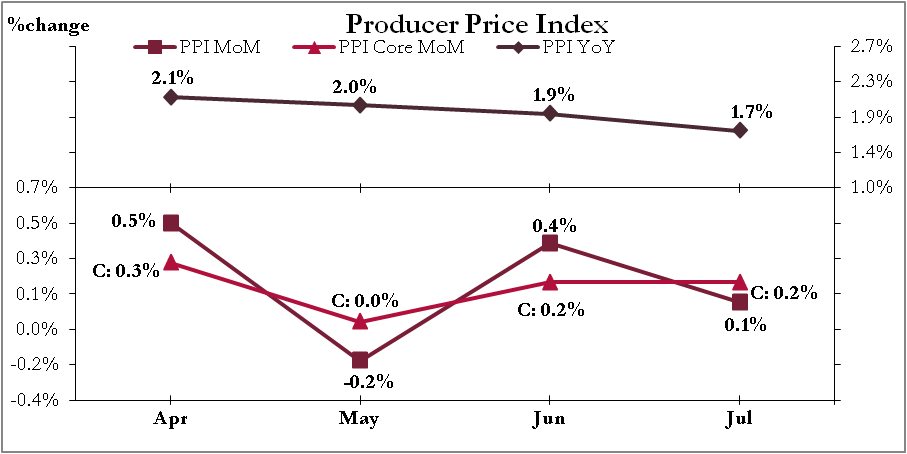
Final demand goods unchanged and Final demand services up 0.1% led by final demand transportation and warehousing services (0.5%).
Intermediate demand: Processed goods (0.1%), Unprocessed goods (-2.7%), Services (0.3%).
REAL ESTATE
Housing Starts
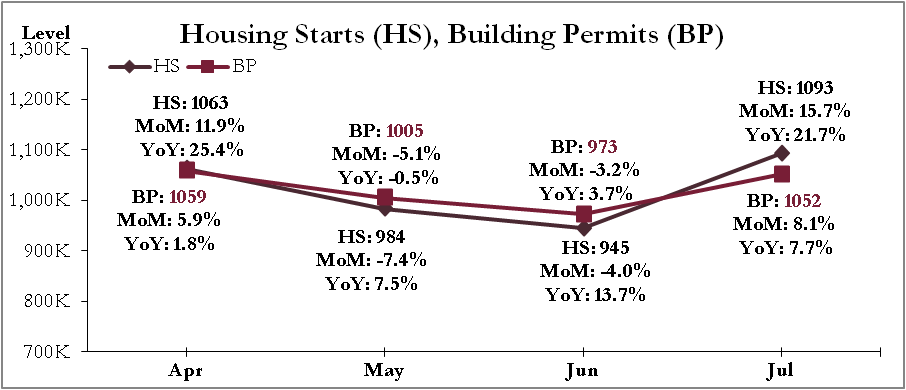
HS MoM regional: Northeast (144K, 44.0%), Midwest (164K, -24.8%), South (511K, 29.0%), West (274K, 18.6%).
BP MoM regional units and % change: Northeast (120K, 18.8%), Midwest (179K, -0.6%), South (515K, 9.6%), West (238K, 7.2%).
Existing Home Sales
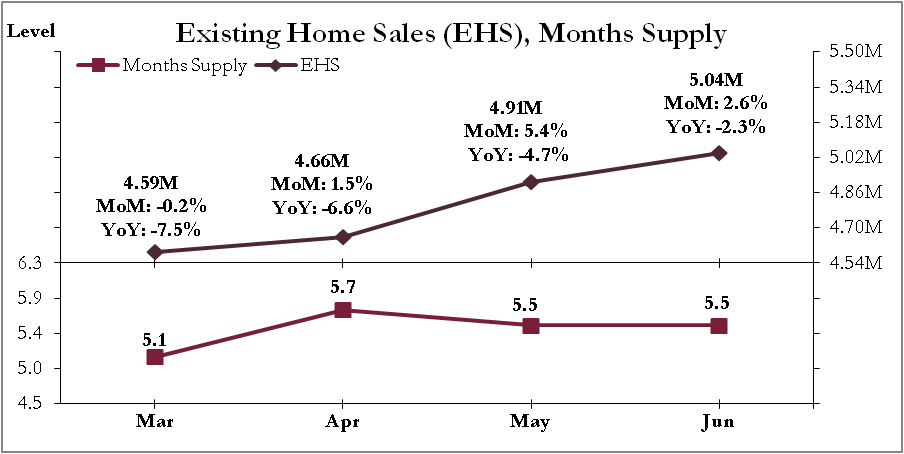
Sales are at its highest pace in 2014 but are 4.3% below the 2013 peak of 5.38 million last July.
NAR Chief Economist: Prices are still affordable, although this advantage should decline as consumer incomes are still lagging behind price gains.
Median time on market was 48 days in July, 44 days last month and 42 days in July 2013.
BUSINESS OPERATIONS
Employment Cost Index
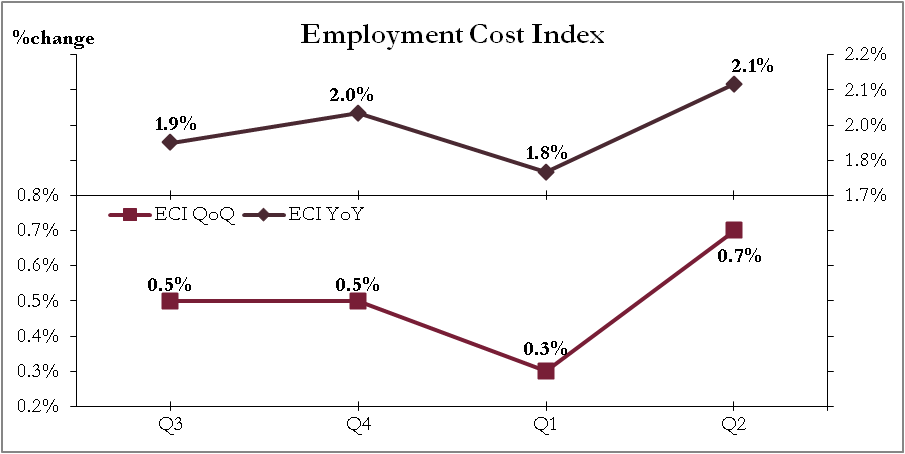
Wages and salaries up 0.6% and benefits up 1.0% in Q2 for all workers.
Total compensation by occupational groups: Management (1.0%), Sales and office (0.8%), Natural Resources, Construction and Maintenance (0.9%), Production, transportation and material moving (0.5%), Service (0.4%).
Purchasing Managers Index
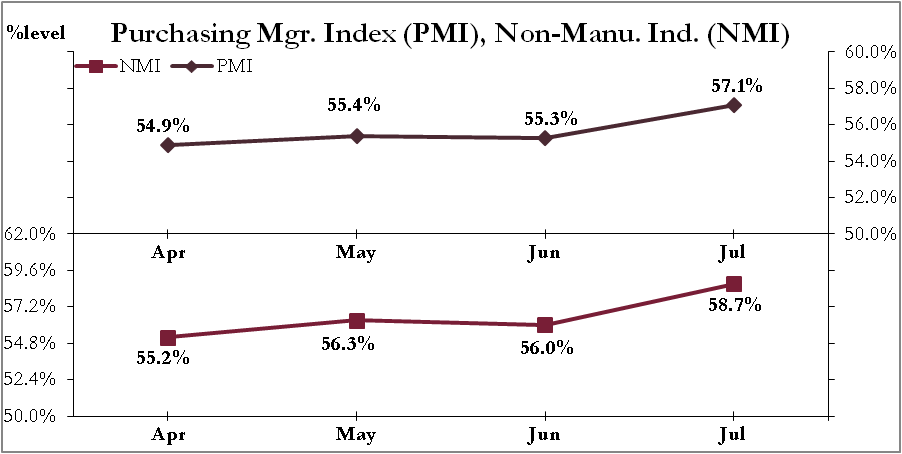
PMI: New Orders (63.4), Production (61.2), Employment (58.2), Supplier Deliveries (54.1), Inventories (48.5). 17/18 industries grew, 1 contracted.
NMI: New Orders (64.9), Business Activity (62.4), Employment (56.0), Supplier Deliveries (51.5). 16/18 industries grew, 1 contracted.
Factory Orders Report
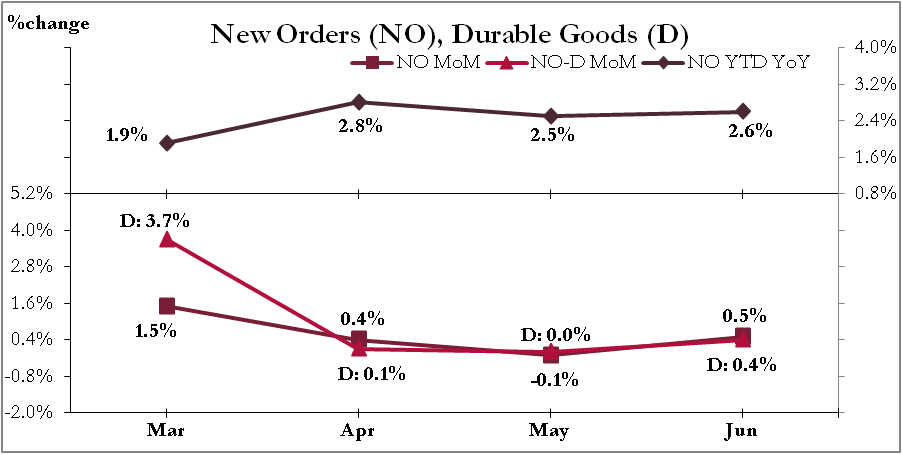
New Orders excluding transportation up 1.1%. Shipments up 0.5%: Durables up 0.4% led by Transportation equipment and non-durables up 0.6% led by Petroleum and coal products. Unfulfilled orders up 1.0%. Inventories up 0.3%.Unfulfilled orders-to-shipments ratio same at 6.52. Inventories-to-shipments same at 1.31.
Wholesale Trade Sales Report
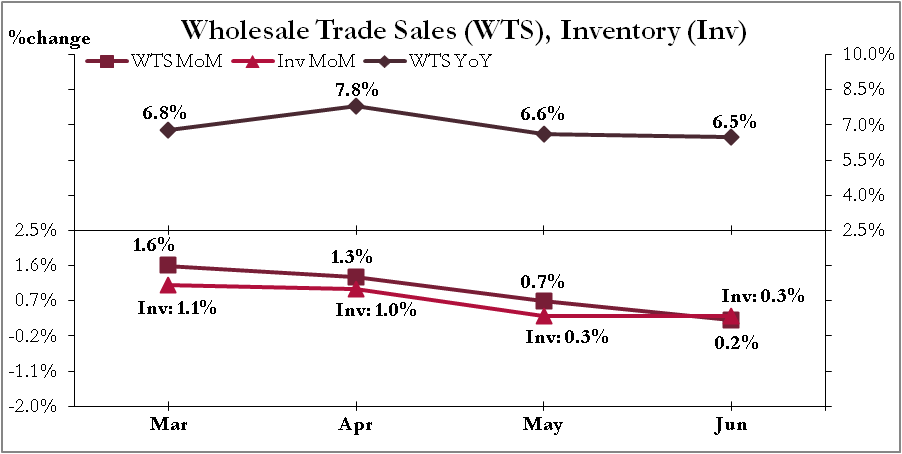
Wholesales of durables up 1.4% helped by Misc. durables (3.2%), but dragged by Hardware (-1.9%). Non-durables down 0.7% helped by Paper (2.4%), but dragged by Farm products (-8.1%).
Inventory-to-sales ratio same as previously revised 1.17.
Retail Sales Report
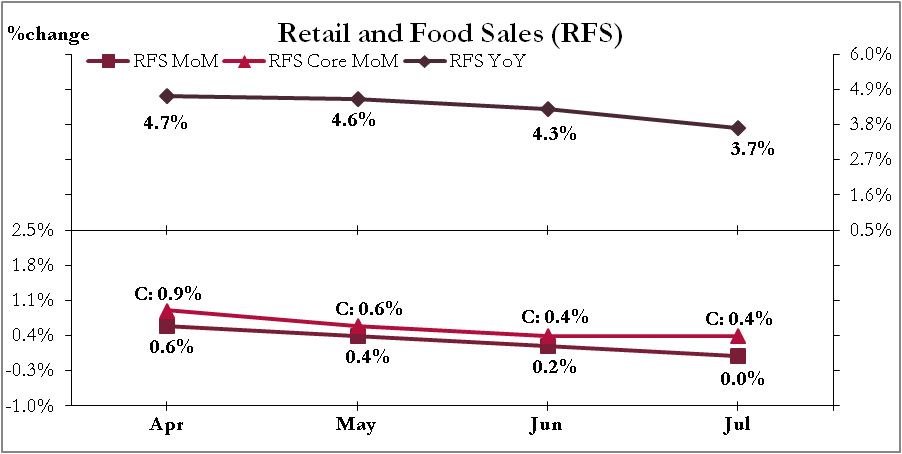
Industries with highest YoY: Health and personal care stores (7.3%), Food services and drinking places (6.2%), Motor vehicle and parts dealers (6.0%).
Lowest YoY: Sporting goods, hobby, book & music stores (-2.2%), Gasoline stations (-1.2%), General merchandise stores (1.1%).
CONSUMERS
August Consumer Confidence up to 92.4% from rev. 90.3%
Consumer Credit Report
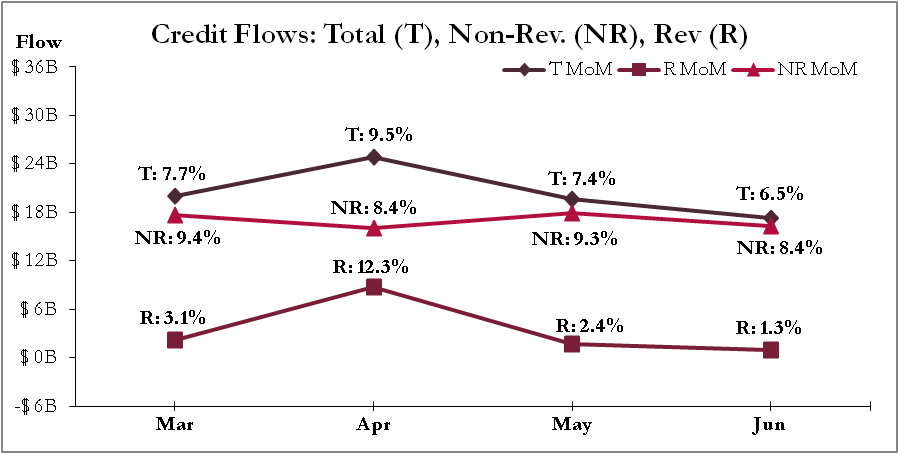
Total credit up $17.3B to $3.21T, non-revolving credit up $16.3B to $2.34T, revolving credit up $.94B to $873.1B. Q2 student loans up $4.3B, auto loans up $25.4B vs. Q1 up $38.7B and $14.1B respectively.
Q2 credit card rate same at 11.83%, and Q2 four-year new car loan rate up to 4.50% from Q1 rev. 4.43%.
Personal Income and Outlays
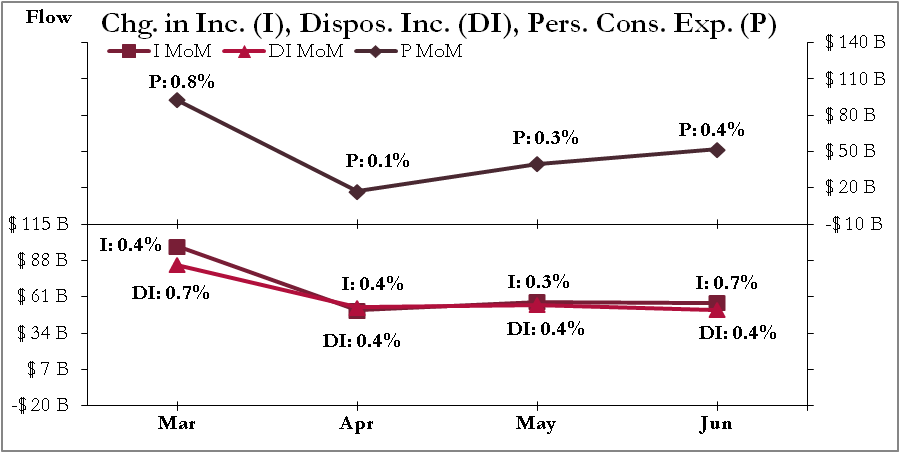
Compensation up 0.2% vs. June up rev. 0.5%. Personal current transfer receipts up 0.3% vs. June up 0.4%
Personal Consumption for: Goods down 0.3% vs. June up rev. 0.8%. Consumption of durables down 0.7%, non-durables down 0.1%. Consumption of services unchanged vs. June up rev. 0.2%.