Note: I wrote this instablog in response to several comments made in response to my article Investment Strategy for an Inflationary Environment. I got the impression that some readers did not fully understand the nature of money or the difference between inflation and rising prices. There were also several comments questioning my use of John Williams' calculation of the CPI over the Bureau of Labor Statistics' calculation. I hope this will be helpful to readers of that article.
Introduction
Dollar devaluation has been a fact of life for Americans for decades.
A quick glance at prices over the years gives this fact a concrete reality that cannot be denied. Here are a few examples. Up until 1948 it cost a nickel to ride the subway in New York City; now it costs $2.50, an astonishing 50-fold increase. In the same year a movie ticket cost just $0.36; now the average movie ticket costs nearly $8. In the 1920s a car would set you back $1,500 whereas now the average car costs $25,000-$30,000. The most expensive ticket to the first Super Bowl cost just $12 in 1967; now it is 100 times higher at $1,200.
The price jumps vary from item to item; and while we can concoct excuses for specific situations, the fact remains that prices for everything have skyrocketed over the years. Furthermore, when we look at the prices of these items in terms of one other, we see much smaller price changes. A 200%+ increase in the price of a subway ride relative to a movie ticket is not insignificant, but it is virtually nothing compared to the 5000% increase it had in U.S. Dollars.
The most obvious conclusion to be drawn from these observations is that dollars are becoming less valuable.
In this article I discuss dollar devaluation as an economic phenomenon and reveal my strategy for investing in an inflationary environment. In part 1 I summarize the Austrian analysis of currency devaluation and explain rising prices as the result of the Federal Reserve's expansionary monetary policy. In part 2 I illustrate the ongoing currency devaluation using data that I hope will resonate with the "typical" American consumer. I also expose the misleading nature of the CPI. Finally in part 3 I discuss ways investors can protect and grow their assets in an inflationary environment.
1--Inflation vs. Rising Prices
If you look up the word "inflation" in the dictionary the definition will usually say that inflation is the phenomenon of rising prices. However in Austrian Economics inflation is not identical to rising prices. In hisTheory of Money and Credit, Mises writes:
In theoretical investigation there is only one meaning that can rationally be attached to the expression Inflation: an increase in the quantity of money (in the broader sense of the term, so as to include fiduciary media as well), that is not offset by a corresponding increase in the need for money (again in the broader sense of the term), so that a fall in the objective exchange-value of money must occur.
Von Mises, Ludwig. The Theory of Money and Credit;. New Haven: Yale UP, 1953, p. 239.
Inflation is an increase in the supply of money. Prices rise as a consequence of a larger money supply because each monetary unit becomes less valuable. The importance of this distinction lies in the observation that prices can rise for many reasons (a supply shortage, increased demand, decreased demand in the monetary unit...etc.) and referring to all of these as "inflation" is unsystematic and theoretically untenable. In this section I intend to clarify the distinction between the inflationary process and the phenomenon of rising prices.
A--Inflation and Quantitative Easing
Inflation is a result of the a combination of two processes: quantitative easing and fractional reserve banking. It is crucial to understand that inflation is not the same thing as "quantitative easing," yet the former is related to the latter.
Quantitative easing, or "money printing," refers to the Federal Reserve increasing the monetary base (aka MB). The Federal Reserve purchases bonds from banks using money it creates "out of thin air" for this purpose. This is basically an accounting trick. The money the Federal Reserve creates is a liability on its balance sheet; the bonds are assets. This process is not unlike a corporation that issues debt: the corporation does not alter its net equity, although it does alter both its assets and liabilities.
This newly created money then replaces bonds on banks' balance sheets. Banks can then lend this money out. After the money is lent out to buy houses or factory equipment or anything else most of it ends up as bank deposits. The banks then turn around and lend some of this money out again. In this way the money supply grows beyond that of the monetary base.
The following example illustrates this process.
Suppose a bank sells a bond to the Federal Reserve for $1,000. The money supply increases by $1,000. The bank then lends this $1,000 to Jane so that she can buy a house. Jane takes this $1,000 and gives it to John, who signs over the deed to his house. John takes that $1,000 and puts it in the bank.
Suppose this happens 1,000 times. The Federal Reserve has created $1,000,000, and so the monetary base has increased by $1,000,000. Furthermore, 1,000 depositors ("Johns") each have $1,000 at the bank on deposit. Thus far the money supply has increased by $1,000,000, or by the same amount as the monetary base.
The bank then makes a bet that at any given time only a certain percentage of these 1,000 people will want their money back at any given time. Say this is 10%. The bank, having $1,000,000 in deposits can then take 100%-10% = 90% of this money and lend it out. They lend out $1,000 each to 900 Janes to buy houses from 900 Johns, who then deposit a total of $900,000 into the bank. Because each of the original 1,000 Johns believe that they have $1,000 each with the bank, and now 900 additional Johns believe that they have $1,000 each with the bank, the money supply has increased by $1,900,000 even though the monetary base has only increased by $1,000,000. When the process is repeated the next time around the money supply increases by $810,000 (90% of $900,000) to a total of $2,710,000, and so on. The process can be repeated indefinitely.
This process is called fractional reserve banking.
Thus we see how quantitative easing potentially, but not necessarily, leads to an increase in the money supply. The money supply increases as a combination of: (1) the Federal Reserve increasing the monetary base, and (2) banks increasing the total amount of credit by "pyramiding" this credit on top of the monetary base. The larger the monetary base, and the smaller the percentage of money that banks keep as reserves to meet depositors' demands, the larger the money supply.
B--Rising Prices
As I have mentioned, the word "inflation" is often used to refer to rising prices. For brevity's sake I will refer to rising prices as "inflation2" where the word "inflation" is used colloquially to refer to generally rising prices.
The fundamental difference between the two is as follows: the rate of inflation2 depends on both the supply and demand of money, while the rate of inflation is the rate of change in the money supply regardless of the demand for money.
Thus if for whatever reason people demand money then the rate of inflation2 will be lower than the rate of inflation. For example Germany went off the gold standard in 1914, although German citizens believed that this was only a temporary measure due to World War 1, and so the increase in the money supply outpaced price increases. Similarly, if the demand for money declines then inflation2will outpace inflation. Continuing the German example, after World War 1 the purchasing power of the German Mark declined more rapidly than the money supply increased because demand for money declined.
2--How Fast are Prices Rising?
The rate of inflation2 cannot be given in a single number. The prices of different items rise at different rates at different times. Additionally, each individual or family experiences inflation2differently because they each purchase different baskets of goods. Nevertheless investors need to have a general idea of how quickly prices are rising in order to prepare for future expenditures.
The U.S. Government's Consumer Price Index (CPI) provides a rate of inflation2 for a basket of goods that a typical individual or family might purchase. Here is a chart of the CPI going back to 1984:
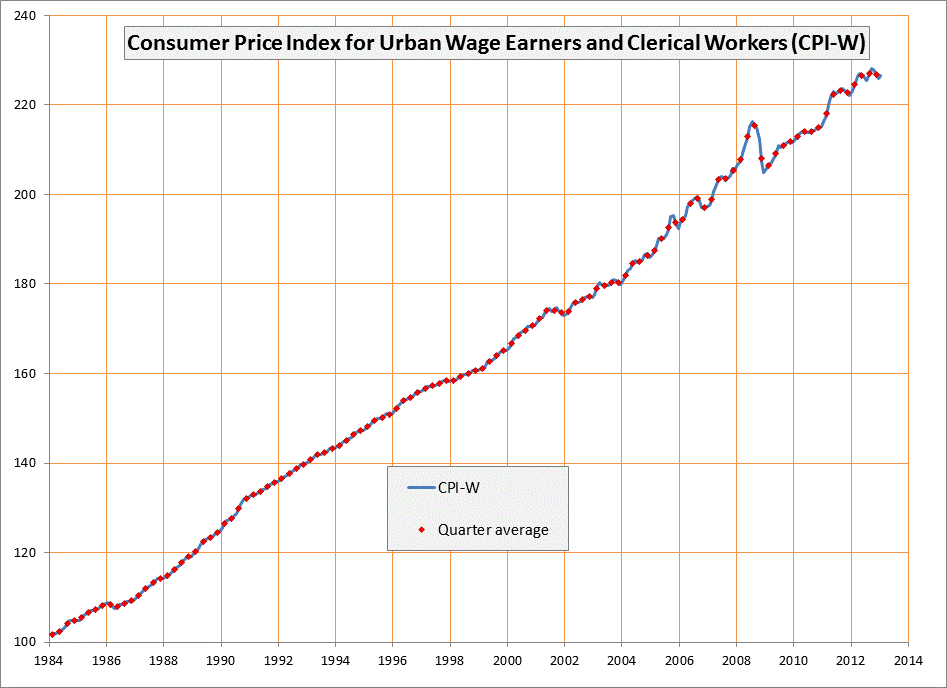
The CPI has increased from 100 in 1984 to roughly 226 presently, which is about a 2.84% increase per year. Looking more specifically at the 21st century the index rose from about 167 (rough average for the year 2000) to 226, or a 2.3% increase per year. The conclusion drawn from this is that a basket of goods that a typical family or individual purchases has increased in price by 2.3% per year.
Intuitively this number seems to be too low. What follows are a few examples of price changes over the past several years of things people buy. It is meant to provide readers with a general idea of what price inflation2 has really been in recent times.
Housing
With the bursting of the housing bubble home prices have inflated only mildly in the 21st century. The Case Shiller home price index compiles data from 20 American cities.
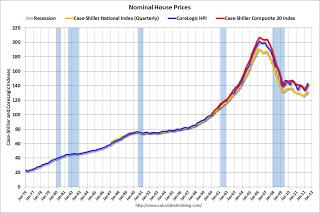
The Case Shiller index was at approximately 100 in 2000, and it is currently at roughly 145, which equates to an annual increase of 2.9%.
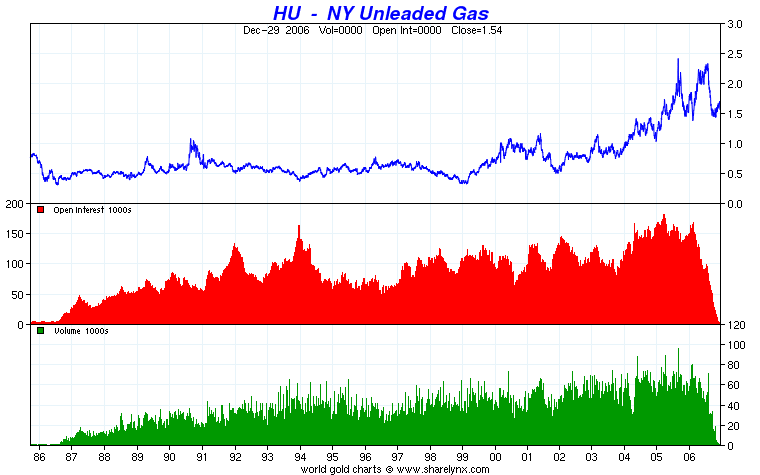
Energy
Gasoline futures (wholesale prices) in 2000 were around $0.75 per gallon, and they currently trade at about $3.15 per gallon, which is an annualized increase of roughly 11.7%.
Retail prices have faired better. In 2000 prices were about $1.25
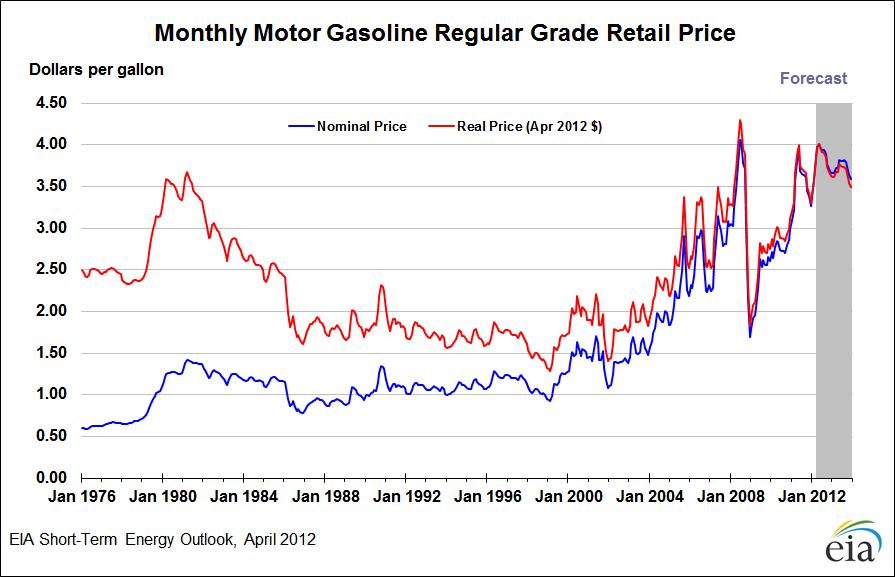
According to AAA current prices are $3.74. This comes out to an 8.8% increase.
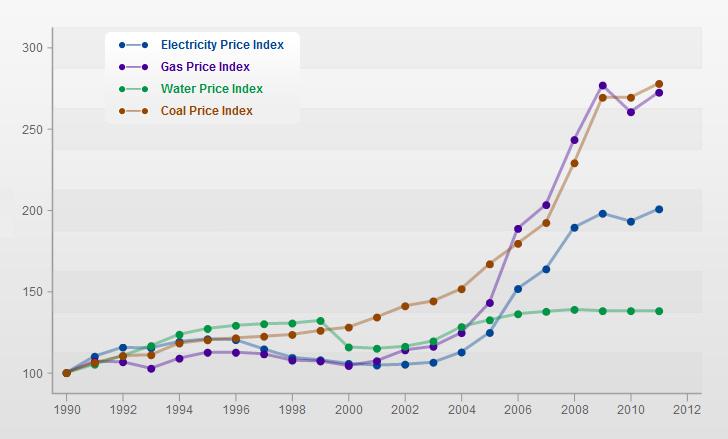
Electricity prices roughly doubled from 2000-2011, which is approximately a 6% increase per year.
Food
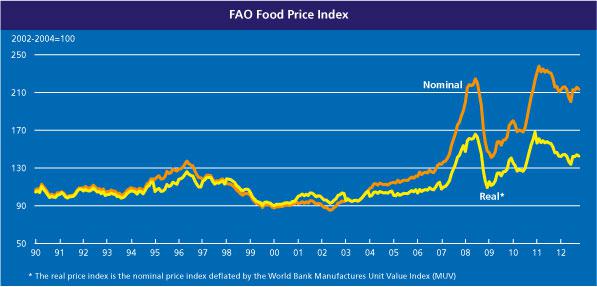
Food prices obviously vary tremendously, so I will give several data points. According to the FAO food price index, which went from 90 in 2000 to 210 in 2013, the average rate of increase has been roughly 6.7%
For some more specific data consider some example provided byFoodtimeline.org. A 2 liter bottle of Coca Cola cost $0.99 according to the Daily Record in 2002, and $1.99 at Foodtown in 2013, which is an annual increase of 6.5%.
In 2000 an 18 ounce box of Kellogg's Corn Flakes cost $2.99, or $0.16 per ounce. In 2013 a 12 ounce box of Kellogg's Corn Flakes cost $3.79, or $0.32 per ounce, which is a 5.5% annualized increase.
In 2003 a 1.55 ounce Hershey bar cost $0.80. In 2011 it cost $0.99, although the prices are from different stores. The annual rate of increase is 2.7%.
In 2004 a 1 pound box of Nabisco Oreos cost $2.99, or $0.19 per ounce. In 2013 a 14.3 ounce box cost $4.59 or $0.32 per ounce, an annualized increase of 6% per year.
Healthcare
In 2000 people who paid into employee sponsored health insurance programs paid $1,619 to insure their families; in 2010 the price was $3,997, which is a 9.5% increase. For individual coverage the price went from $334 to $899 during the same period, which is an annualized increase of 10.4%

NYC Subway Ride
In 2000 a NYC subway ride cost $1.50; now it costs $2.50, which is a 4% annualized increase.
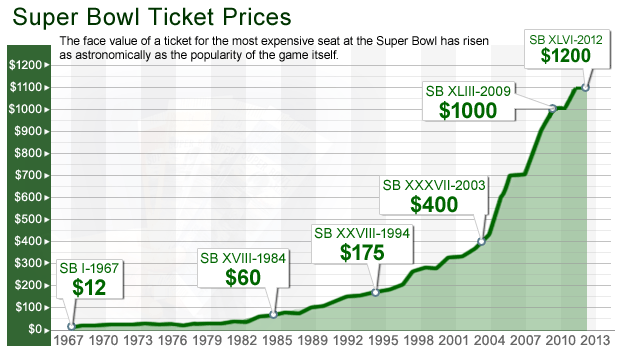
Super Bowl Ticket Prices
In 2000 the most expensive Super Bowl tickets cost about $280; now they cost $1,200, which is a 12% annualized increase.
Movie Ticket Prices
In 2000 the average movie ticket cost $5.39; in 2011 the price was $7.93, which is a 3.6% annualized increase.
Again I must stress that this data only provides a partial picture of how prices have been rising during the 21st century. Nevertheless I can confidently conclude that most Americans have seen their living costs rise faster than the CPI suggests.
2A--Deconstructing the CPI
Why the Government Understates Inflation2
The government has three primary incentives to understate inflation. First, if people believe that the CPI is accurate they will be more likely to hold dollars, and this consequently benefits the demand side of the supply-demand equation for dollars.
Second, the government has expenditures that are directly correlated with the CPI. Government benefits such as Social Security are designed to increase with inflation2, and cost of living adjustments are determined by the CPI. If the CPI understates the rate at which prices are rising then COLAs are smaller than they should be, which saves the government money. Also, the government issues inflation protected treasury bonds, or TIPs, that link payouts to bond-holders to the CPI. If the CPI understates inflation then TIP payouts are lower which saves the government money.
Third, GDP data is corrected for inflation2 as determined by the CPI. If the CPI understates inflation2 then the GDP appears to be larger and growing faster (or shrinking more slowly) than it really is. This in turn makes the government's economic policies appear to be more favorable than they really are, and the public will show greater support for spendthrift politicians.
How the BLS Manipulates the Data
The Bureau of Labor Statistics employs two tactics in order to understate the CPI. First, it incorporates what are known as hedonic adjustments into the CPI. Let's say that a car costs $30,000 in 2010 and $33,000 in 2011. This should be represented as a 10% increase. But the BLS might claim that $1,500 of this $3,000 increase is due to improvements in the product, and so the price increase is only considered to be 5%. There are two issues with this line of thought. First, hedonic adjustments are subjective as they can be calculated as the BLS chooses. Second, hedonically adjusted prices do not reflect consumer experiences, because products are only available with the improvements that justify hedonic adjustments.
Second, the BLS uses what is called substitution bias. The idea here is that prices of certain items rise faster than others, and consequently consumers will switch from those items whose prices are rising more quickly to those items whose prices are rising more slowly. This might be the case for some products. For example, if the price of chocolate ice cream rises faster than the price of vanilla ice cream then one might be able to justify weighting the latter more in the CPI than the former. But this reasoning does not apply to essential items. Suppose that we lived in a world where there are only two products--clothing and food--and each product is 50% of the CPI. According to substitution bias if the price of clothing rises and the price of food remains the same, then people would spend more money on food than they did before the price increase. But if there is an individual who could barely afford these items before the price change what the BLS is essentially saying is that this individual will forego clothing himself and eat more than he needs to. Yet it is natural to assume that this individual will attempt to find a way to cut down on his food consumption so that he can clothe himself.
John Williams of ShadowStats provides data that eschews these statistical games by calculating the CPI using the methodology employed by the BLS before these adjustments were incorporated.
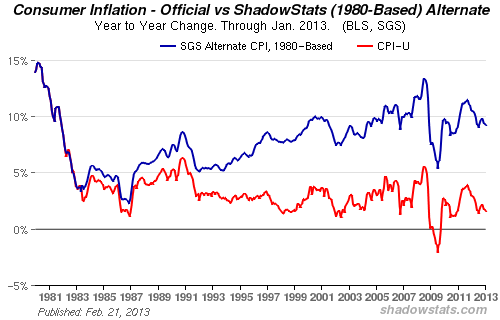
If John Williams is correct then the 21st century has seen inflation2that averages in the high single digits, which reflects fairly accurately the figures in the above examples.