Those who follow my blog know that at the end of last year, I made a number of predictions...One was a carryover from more than 2 years ago when I started pounding the table here, stating unequivocally that this bull market cannot not die because the NASDAQ needs to make a new all-time high...That prediction finally came to pass exactly one month ago on June 19th, 2015, when after 15 long years of lagging the DOW, the S&P and the Russell, the NASDAQ finally made a new all-time high, eclipsing its March 10th, 2000 high of 5,132.52...Phew, about time!
My other bull calls were on Exact Sciences (EXAS), Halozyme (HALO), the Russell 2000 ETF (IWM), the Nasdaq 100 ETF (QQQ) and OREX: seekingalpha.com/instablog/6566781-optio... Of all those stocks, HALO by far, has been the top performer and continues to act like the Energizer Bunny on steroids...however, it may need to take a breather here and come and backtest the $20 level...
Then at the start of the year, I became very bullish on Ziopharm Oncology (ZIOP) and have written a number of posts on the company, with the most recent being last week's 101 Reasons to Own Ziopharm Oncology . As I wait for ZIOP to break what will soon be a triple-top @ $14, move into all-time high territory and then reach my interim price target of ~$20, I am continuously monitoring a number of other potential opportunities that are on my radar, looking for and catching the elusive one that will make the next big run...
Since my last few blog posts have been mostly ZIOP centric, I want to be clear that there is more to my market interest than ZIOP and hence this post... :)
As I was doing my due diligence yesterday, I realized that one of the companies that I have been monitoring, triggered a major Buy signal during this past week's trading period...Since I noticed the BUY signal this weekend and being that I am very confident about its accuracy, I'll need to go to work immediately tomorrow morning when the markets open and start building what I hope to be a significant CALL position in the company while keeping my fingers crossed that the stock does not take off until I have had enough time to accumulate...if anything, I would love to see the stock actually come down...being that currently its price is in a column of Xs on its PnF chart, I am hoping that the stock pulls back enough to make a 3 box reversal, switch back into Os and then take off in earnest...this way not only will I get more time to accumulate, but also snag better prices on my purchases...
Being that I have not yet built my position in this company, and the fact that its options' market is pretty illiquid, I'm not at liberty to share my pick here just yet...I hope you will all appreciate my position...but as soon as I have completed my purchase, I will...the good news is that this stock is off more than 42% from its all-time high set all the way back in December of 2013 and being that I'm very confident in the accuracy of this Buy signal, plus the company's fundamentals back up the technical signal, I fully expect the stock to not only go back to its all-time high, but should breakout into blue sky territory...
Since one of the reasons I started this blog was to share my knowledge of reading the technicals of a stock's price pattern(s) with others (in other words, the price charts, both Candlesticks and Point and Figure), I will go ahead and share this mystery stock's PnF chart and its weekly Candlestick chart and explain the developing bullish technical signal that has me convinced that the stock has completed its 19 month long downtrend and is on the cusp of starting a brand new uptrend...My hope is that by sharing this information just before what I believe to be the pivot, and hopefully once the signal is validated in the next few weeks, my readers will be able to appreciate its value and start searching for similar patterns on the charts of stocks they follow and profit from it...
For all those who think that looking for and playing with chart signals is akin to playing with voodoo dolls, there is nothing that I can do to change their already set minds other than to prove it with examples...Longtime readers of my blog will recall that it was another technical signal, that allowed me to call the bottom on Apple after its long correction (pre-split) from $700+ to sub $400...and again, it was another technical signal, this time on the Nasdaq, that prompted me to call the bottom on the Index right after the well-known hedge fund manager, David Tepper had turned bearish on the markets and apart from my technical signal, I also cited Tepper's bearishness as one of the reasons (contrarian) I turned bullish; and then, 2 weeks after I called the bottom, he turned 180º and became bullish again...which prompted me to write the post, David Tepper Couldn't Be Reading Options2Wealth...Could He?
Like everything in life, nothing is fool proof, but I can assure all the skeptics that signals generated by chart patterns work more often than not...
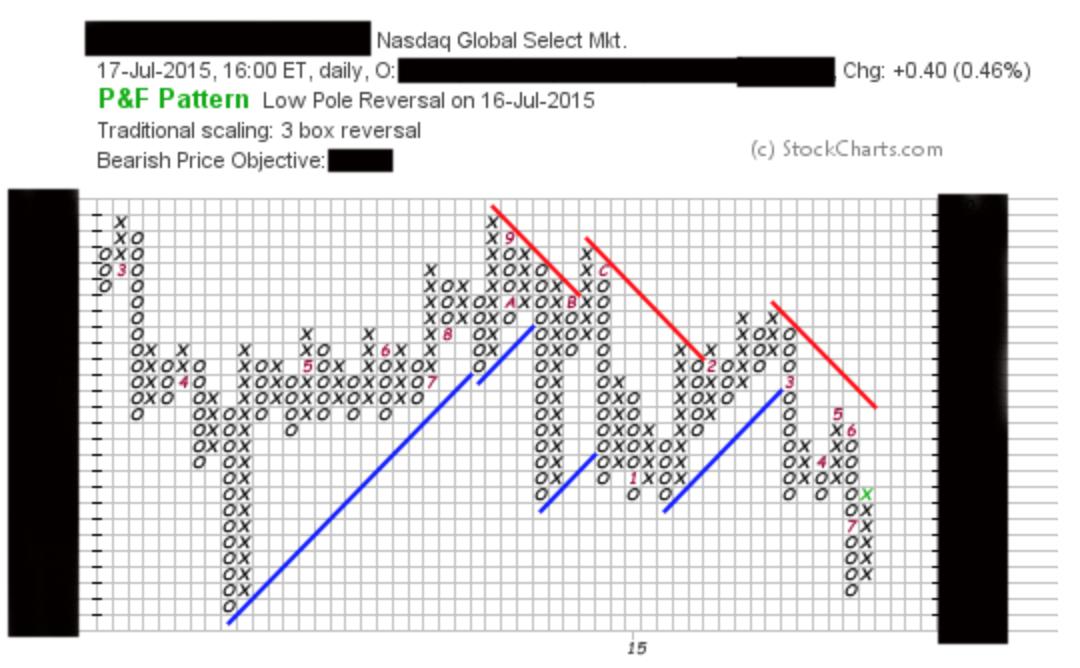
Getting back to my "mystery stock," let me start by first sharing its PnF chart and as we can see, the chart actually has a Bearish Price Objective! Clearly the PnF chart is still identifying the stock as being in a downtrend...
Now let's look at its weekly Candlestick chart going back 3 years(!)...

As we can see, the stock is trading in a downward slope channel...and in fact, the week before last, it actually broke through that channel, but then last week it recovered back above it on slightly higher volume...And when we draw a line across the highs and the lows, we get an extremely tight wedge pattern...This past week, after jumping back above its downward sloping channel, the stock actually went and bumped into its resistance line and in fact, on Friday, intraday, the price spiked even higher, penetrating the upper resistance line before settling just below it...Note also the spike in the stock's RSI, switching from extremely oversold position to a somewhat respectable 40+ area...Clearly there is still some risk involved with this stock which I believe should be cleared up this coming week...last Friday's intraday spike that for the very first time in more than a year and a half pierced through its rsistance line is, I believe, a telling sign...
You may recall that in my post ZIOP: Let's Connect the Dots..., I had highlighted a similar wedge pattern in ZIOP's chart where the stock price had pierced through the upper band of the wedge and then pulled back...That spike in ZIOP's stock price which pierced through the wedge was just a little over $10 and in the chart displayed in that post, the stock's closing price was shown to be $9.77...In that post I had observed:
"On ZIOP's 6 month chart, I have drawn trend lines to show resistance and support areas on the chart and as you can clearly see, yesterday, for the first time since ZIOP made an intraday high of $14.40 way back on March 20th, the stock finally was able to penetrate through that resistance line! Even though the stock could not park itself above that line, but just the mere fact that it was able to pierce through it, is very significant..."
This past Friday ZIOP closed at $12.95, up more than 30% since the stock's price pierced its downward sloping resistance line...
Just like ZIOP's chart confirmed to us the end of its 3 month long consolidation, a very similar pattern in our mystery stock's Candlestick chart confirms to me the end of its 19 month long correction and that it is about to embark on a brand new uptrend that should last multiple months (6-12 months) and its stock price should appreciate at least 75% and in fact, a double from here is just as likely...
I hope to complete my CALL position in this stock in the next week or so at which time I will share the company's name...Like I said, I expect this to be a multiple month ride and everyone who jumps on this train will enjoy one doozy of a ride...
Best~
karim
DISCLAIMER: All postings made here are strictly for my personal record keeping and in no way, shape or form, am I even remotely suggesting others to follow my Buy and Sell moves. Trading options is definitely not for the faint of heart as one's portfolio can move up, or down, anywhere between 10%-30% during a single trading day. Feel free to follow my progress here, but PLEASE do not follow my moves. However, if, in spite of all my exhortations, should you decide to do so, be advised that you, and ONLY YOU will be responsible for any losses that you may suffer...In other words, the onus is strictly on you.