A sharp price decline of 8% in the price of spot gold over the past month may have created a short term buying opportunity in the commodity, but divergence on the weekly chart shows a sign that the long term trend is failing. Multiple signs that the long term trend is weakening are coming from both the weekly chart and the daily.
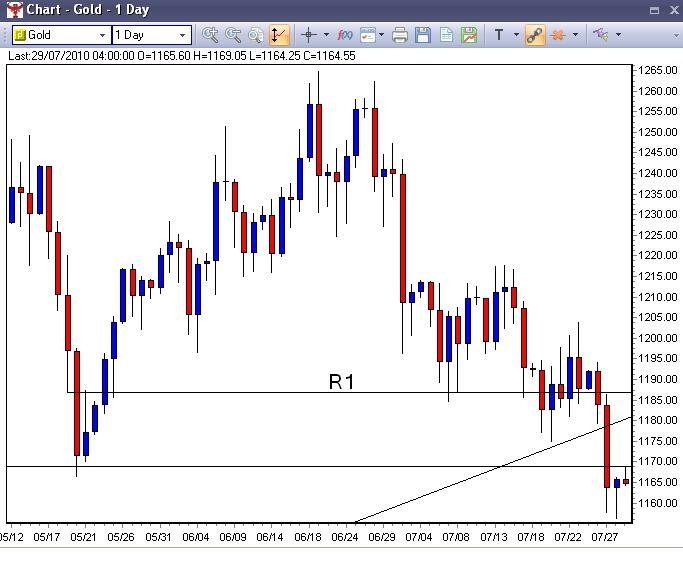
Following yesterday's disappointing U.S. core durable goods orders, the price of spot gold rose to $1165.60 after opening the day at $1163.45. The commodity fell to a low on the day to $1156.25. Following this price action, the end result was a hanging man candlestick that could signal a rally in the price of spot gold if the commodity can breach above the $1169 resistance level. A short term boost in the price could be to the resistance at $1186.
The weekly chart of spot gold shows the commodity has breached below the long term trend line that began in October of 2008. A weekly close below the line would confirm the breach of the trend, providing a shift in the long term trend of the commodity.
At the time the price hit a record high price at $1265, an evening doji star candlestick pattern formed, a warning that the long term bullish trend is changing. Confirmation of the pattern came the next week with the long red candlestick. Supporting the downward move is a doji candlestick that formed the following week after the evening star pattern.
But what stands out most for the weekly chart is the divergence that is appearing on the slow stochastic oscillator. Divergence occurs when prices reach a new peak but an indicator fails to reach a new peak.
When the price of spot gold reached a new high on June 21st, the slow stochastic oscillator rose to a new high. But shortly after when the price rose to a new all time high, the slow stochastic oscillator did not make a new high. This shows divergence in the price of the commodity and the oscillator, signaling that the trend is weakening.
Divergence for the slow stochastic provides a strong sell signal in preparation for an oncoming drop in the price of a commodity, perhaps more powerful than the crossing of the stochastic lines.
This is yet another tool in a trader's tool chest that allows one to identify potential tops and bottoms in trending markets.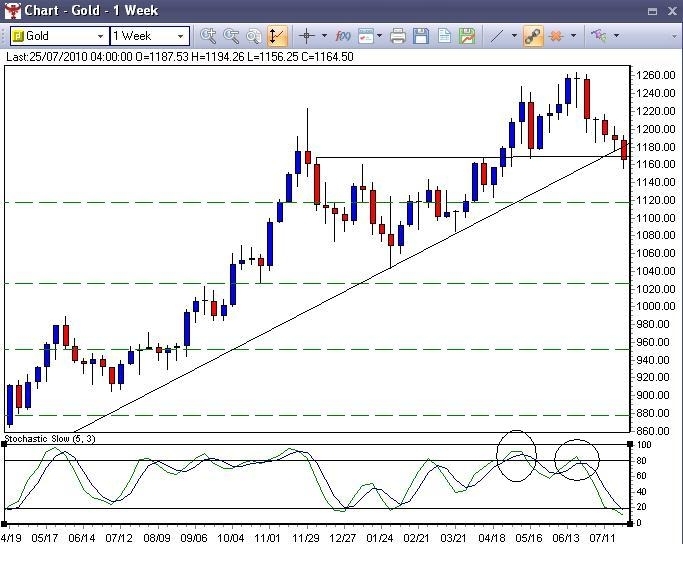
Disclosure: No positions