I've started a quarterly newsletter shared publicly although some files are only available to site supporters. Hope some find some of the information useful.
Market View
Our market view is determined through tracking the Shiller PE. We measure the PE against five year intervals going back 25 years. The median range for the graph is a high of 26.32 (1995) to a low of 21.9 (2009); a range which we'll call the new normal.
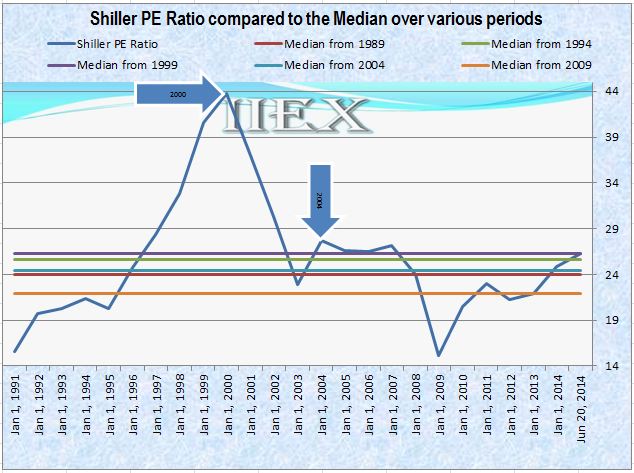
The previous 25 year range (1996-1991) was 19.77 to 22.4. The internet has changed the investing world. Advances in technology revolutionized trading allowing easy access to information and trading for the investor, resulting in more participation both in the USA and around the world. This is why I think the term "new normal" is appropriate. While we are at the top of the range the market is pricey but not frothy as seen in 2000 and less so in 2004. Absent a major shock such as the financial crisis we could see a 10 to 15 percent correction but since we are still within the "new normal" the market could continue its upward trek before concerns about an overpriced market take hold.
A big unknown longer term is any negative market consequences as the Federal Reserve unwinds quantitative easing. Will inflation remain relatively tame? Corporate borrowing could get squeezed if rates rise to far affecting growth and earnings, which will impact the Shiller graph.
I'm a value stock picker and only sell when a stock becomes overvalued as measured by the "IIEX_FairValue Analysis" program. The other side of the coin is it's hard to find bargains as the Shiller PE level remains at or rises above current levels. I'm cautious and not selling stock based on the Shiller PE (macro level), but accumulating cash when individual holdings become overvalued to take advantage of any bargains that may appear on the radar. History shows the Shiller PE can be a good measure of market valuation but the timing of any correction is impossible to predict. The Shiller graph is also a good indicator of when there is value to be found (or not) depending which direction the curve is trending.
Focus Stock (LVLT)
Level 3 Communications was made the IIEX focus in July 2013 after a change in leadership and direction was announced and is trading at a discount to our latest fair value calculations as of this writing. I've followed this stock for many years seeing major potential but not under previous leadership and finally after a long and troubled history the change was made. Our last four articles provide much more insight:
Will The Acquisition Of TW Telecom By Level 3 Communications Accelerate Cash Growth?
Level 3 Communications A Long-Term Gem In The Making
Is Level 3 Communications Taking Advantage Of The Opportunity Laid Before It? - Part 2
Can Level 3 Communications Take Advantage Of The Opportunity Laid Before It?
The stock has more than doubled since last July (2013) and is up more than 30% from the start of the year. Our fair value based on recent results and the acquisition of TWTC is $56. Data for LVLT can be found here. The LVLT Excel spreadsheet is available to supporters of the website.
Template Updates (for website supporters only)
I've been busy working on various templates and have spent a lot of time on what I'll call my flagship template titled "IIEX_FairValue Analysis_YYYY-MM-DD". If you haven't checked it out give it a try and let me know what you think. This is a stock analysis program built in the Excel environment. The current list of available templates are:
IIEX_FairValue Analysis_2014-06-22.xlsb |
IIEX_InsiderBuySell_2014-03-31.xlsm |
IIEX_Newsfeed_2014-02-02.xlsm |
IIEX_SA Ticker-author search.xlsm |
SMF_10yr Financials_2014-04-25.xlsx |
SMF_Shiller PE_2014-03-19.xlsx |
SMF_Short Interest_2014-02-11.xlsx |
SMF_DDM-Dividend Data_2014-05-05.xlsm |
SMF_DCF analysis_2014-04-27.xlsm |
SMF_Modified Graham Analysis_2014-04-25.xlsx |
SMF_Dupont Model_2014-04-30.xlsx |
SMF_US-Inflation Calculator_2014-03-27.xlsx |
FR_SP_10yrTreas_CorpBond_2014-04-10.xlsm |
FR_Unemployment-Labor ForceParticipationRates_2014-04-07.xlsx |
O_Send Email with Excel_2014-03-25.xlsm |
Level_3_Model_2014-06-19.xlsm (requires smf add-in) |
GeneralExcelModules_2014-06-04 |
"IIEX_FairValue Analysis_2014-06-22.xlsb" recent updates: Added the ability to update portfolio prices and revise the PE & DCF inputs shown on the portfolio tab. Changes made will automatically be highlighted in yellow. To accept changes click the button below the PE & DCF input columns. Fixed a minor bug on the DCF page. Also importing previous data may only work going forward to a code change.
"GeneralExcelModules_2014-06-04" is not a template but includes code in modules you can use in your own VBA programs that is compiled from some of my work and internet sources. All code is a beginner to intermediate level.
All feedback is always welcome.
Dave
Disclosure: The author is long LVLT.