This is my first post. First Citizens Banc Corp is my local bank and I have been a long-time stockholder. It was hit hard the last 5 years, but the fundamentals are there.
Back on March 20, Director Allen Nickles invested $3,375.00 into 500 shares of FCZA, for a cost per share of $6.75. In trading on Thursday, shares were changing hands as low as $7.16 per share, which is 6.1% above Nickles's purchase price. First Citizens Banc Corp. shares are currently trading -1.51% on the day. The chart below shows the one year performance of FCZA shares, versus its 200 day moving average:
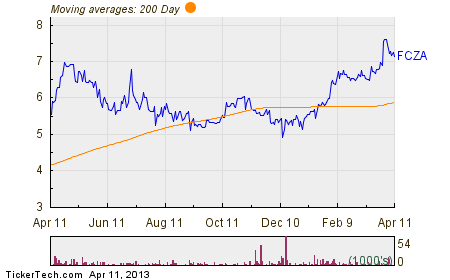
Looking at the chart above, FCZA's low point in its 52 week range is $4.91 per share, with $7.71 as the 52 week high point - that compares with a last trade of $7.16. By comparison, below is a table showing the prices at which insider buying was recorded over the last six months:
| Purchased | Insider | Title | Shares | Price/Share | Value |
|---|---|---|---|---|---|
| 01/17/2013 | Michael J. Close | Director | 4,500 | $5.53 | $24,891.00 |
| 01/31/2013 | Allen R. Nickles | Director | 3,600 | $6.00 | $21,600.00 |
| 02/06/2013 | Allen R. Nickles | Director | 4,900 | $6.50 | $31,850.00 |
| 03/20/2013 | Allen R. Nickles | Director | 500 | $6.75 | $3,375.00 |
The DividendRank report noted that among the coverage universe, FCZA shares displayed both attractive valuation metrics and strong profitability metrics. The report also cited the strong quarterly dividend history at First Citizens Banc Corp. , and favorable long-term multi-year growth rates in key fundamental data points.
Dividend investors approaching investing from a value standpoint are generally most interested in researching the strongest most profitable companies, that also happen to be trading at an attractive valuation.
The annualized dividend paid by First Citizens Banc Corp. is $0.16/share, currently paid in quarterly installments, and its most recent dividend ex-date was on 04/12/2013.
Earnings
| 2011 | 2010 | 2009 | 2008 | 2007 | |
| Net Income/(loss) (000) | $3,958 | $(1,268) | $1,655 | $(38,978) | $6,885 |
| Preferred dividends and discount accretion on warrants (000) | $(1,176) | $(1,176) | $(955) | - | - |
| Net Income/(loss) available to common shareholders (000) | $2,782 | $(2,444) | $700 | $(38,978) | $6,885 |
| Per Common Share (1) | |||||
| Earnings/(loss) (basic and diluted) | $0.51 | ($0.16) | $0.21 | ($5.06) | $1.25 |
| Earnings/(loss), available to common shareholders (basic and diluted) | $0.36 | ($0.32) | $0.09 | ($5.06) | $1.25 |
| Book Value | $13.30 | $12.58 | $12.82 | $9.94 | $16.37 |
| Dividends Paid | $0.03 | $0.00 | $0.25 | $0.91 | $1.12 |
Balances | |||||
| 2011 | 2010 | 2009 | 2008 | 2007 | |
| Assets (millions) | $1,113.0 | $1,100.7 | $1,102.8 | $1,053.6 | $1,119.3 |
| Deposits (millions) | $901.2 | $892.5 | $856.1 | $809.9 | $839.8 |
| Net Loans (millions) | $764.0 | $745.6 | $775.5 | $787.8 | $787.4 |
| Shareholders' Equity (millions) | $102.5 | $97.0 | $98.8 | $76.6 | $126.2 |
Performance Ratios | |||||
| 2011 | 2010 | 2009 | 2008 | 2007 | |
| Return on Average Assets | 0.35% | (0.11%) | 0.15% | (3.54%) | 0.89% |
| Return on Average Equity | 3.96% | (1.27%) | 1.68% | (31.57%) | 8.78% |
| Equity Capital Ratio | 9.21% | 8.81% | 8.96% | 7.27% | 11.28% |
| Net Loans to Deposit Ratio | 84.77% | 83.54% | 90.59% | 97.27% | 93.76% |
| Loss Allowance to Total Loans | 2.71% | 2.84% | 1.93% | 1.11% | 0.93% |
Disclosure: I am long DIS, DUK, FCZA, GE, MO, PM, SJM, WEC, XOM.