As the U.S. navy deploys more ships to the Middle East and North Africa to monitor conflicts in the region, General Dynamics (GD) is set to benefit. Plus, other divisions could see increased sales. Further, upgrades and earnings surprise could be in the future.
GD is the largest manufacturer of submarines and destroyers for the U.S. navy. On March 9th, the company received a $11.2 million Navy contract for radar and missile defense systems. http://finance.yahoo.com/news/General-Dynamics-gets-112-apf-4138102149.html?x=0&.v=1 This adds to an $11.5 million contract received in September of 2010.
The company has four main divisions:
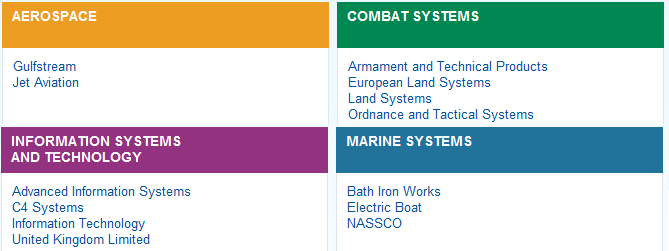
Gulfstream manufactures business jets. The market for business jets seems to be growing with increasing demand from China. Jet Aviation provides business jet services including maintenance and engineering and controls a fleet of more than 200 aircraft. Plus, with stricter TSA standards, both units could see an increase in sales.
The Armaments and Technical Products unit manufactures weapon and armament systems, ship missile systems, defensive armor, countermeasures, aircraft gun and ground systems, unmanned aircrafts, and off-road axle and suspension systems. It is also a leading U.S. producer of biological and chemical detection systems. The European Land Systems unit manufactures combat vehicles and is a leading producer of armament combat systems and munitions. The Land Systems unit is a leading provider of combat vehicles including the M1 main battle tank. The Ordnance and Tactical Systems unit tests and provides munitions and weapons. This division could be the hardest hit by defense cutbacks. But unmanned aircrafts are seeing increased demand.
The Advanced Information Systems unit provides intelligence systems to homeland security and defense customers. The C4 Systems unit provides communication systems mainly to defense and government customers. The Information Technology provides IT services to defense and homeland security. The United Kingdom Limited unit contracts armored fighting vehicles (AFV), avionics, tactical systems, chemical and nuclear solutions, and surveillance systems to the British Armed Forces and abroad. This division may see an increase in spending, especially in homeland security.
Iron Bath Works builds destroyers, while Electronic Boat builds ballistic missile and attack submarines. NASSCO is the only major ship construction and repair shipyard on the West Coast. NASSCO is constructing the Navy's Lewis and Clark-class of T-AKE dry cargo-ammunition ships and is working on designing the next generation of Mobile Landing Platform ships. The company also constructs commercial product carriers for domestic cargo transportation. This division should not see much of any cut in spending.
Below is a breakdown of revenue from each division:
Aerospace Revenue (Billions) | Combat Systems Revenue (Billions) | ||||
| 2010 | 2009 |
| 2010 | 2009 |
1st Quarter | 1.357 | 1.455 | 1st Quarter | 2.002 | 2.407 |
2nd Quarter | 1.383 | 1.415 | 2nd Quarter | 2.111 | 2.405 |
3rd Quarter | 1.291 | 1.120 | 3rd Quarter | 2.069 | 2.347 |
4th Quarter | 1.268 | 1.181 | 4th Quarter | 2.696 | 2.468 |
Marine Systems Revenue (Billions) | Information Systems Revenue (Billions) | ||||
| 2010 | 2009 |
| 2010 | 2009 |
1st Quarter | 1.639 | 1.669 | 1st Quarter | 2.752 | 2.733 |
2nd Quarter | 1.637 | 1.625 | 2nd Quarter | 2.973 | 2.655 |
3rd Quarter | 1.700 | 1.518 | 3rd Quarter | 2.951 | 2.734 |
4th Quarter | 1.268 | 1.181 | 4th Quarter | 2.696 | 2.468 |
The Information Systems and Technology division provides almost twice as much revenue as the aerospace division. The only division that seems to be loosing revenue is the Combat Systems. However, the division experienced a surprise jump in revenue in the 4th quarter. The Combat Systems division saw a $405 million decrease in revenue in the 1st quarter of 2009 to 2010. Over the same period, the Aerospace division saw a $98 million decrease, the Marine Systems division saw a $30 million decrease, and the Information Systems and Technology division saw a $19 million increase in revenue. That is a combined $514 million decrease in revenue when comparing the 1st quarter of 2009 to 2010.
But when comparing 4th to the following 1st quarter, the Aerospace division saw an increase of $176 million. Over the same period, the Combat Systems division saw a $466 million decrease, the Marine Systems division saw a $458 million increase, and the Information Systems and Technology division saw a $284 million increase in revenue. That is a combined $452 million increase in revenue when comparing the 4th quarter to the following 1st quarter.
Taking the comments on division increase or decrease spending in paragraphs 3-6, lets assume that there is exactly no change in increase and decrease of revenues from the 4th to following 1st quarter. That means the Aerospace division makes $1.444 billion, the Combat Systems division makes $2.23 billion, the Marine Systems division makes $1.552 billion, and the Information Systems and Technology division makes $3.148 billion. Adding that all together is $8.374 billion in revenue.
G% | year over year quarterly revenue growth (%) | P/B | price/book |
tPE | trailing PE ratio | PEG | price/earnings/growth |
fPE | forward PE ratio | R/S | revenue/share |
P/S | price/sales | % | % short |
| Price | G% | tPE | fPE | P/S | P/B | PEG | R/S | % |
GD | 76.13 | 8.90 | 11.18 | 9.90 | 0.87 | 2.11 | 1.34 | 85.16 | 0.9 |
BA | 71.64 | -7.70 | 16.08 | 13.57 | 0.82 | 19.0 | 1.87 | 87.12 | 1.4 |
FRPT | 5.01 | -44.20 | 15.27 | 11.93 | 0.47 | 1.09 | 1.30 | 10.73 | 2.9 |
LMT | 80.47 | 4.80 | 10.13 | 9.34 | 0.60 | 7.38 | 1.30 | 125.76 | 5.7 |
NOC | 66.10 | -3.60 | 9.69 | 8.44 | 0.56 | 1.42 | 0.90 | 117.07 | 3.3 |
RTN | 52.13 | 3.30 | 10.85 | 9.36 | 0.74 | 1.91 | 1.29 | 67.57 | 1.7 |
TXT | 26.66 | 11.20 | 95.21 | 14.26 | 0.69 | 2.46 | 1.06 | 38.35 | 9.1 |
Comparing it to its top competitors, GD is not cheap. It has the highest P/S among the group. On the plus side, it has the 2nd highest year over year quarterly revenue growth and the lowest percent short. Notice that the revenue/share is greater than the price for all stocks in the list, meaning all these stocks may be undervalued. A forward PE of 9.90 is lower than the S&P 500 average PE of 16.40.
One thing that can push GD higher or lower is either upgrades or downgrades. The company reports 1st quarter earnings April 27th before the bell.
Consensus:
Earnings: $1.62
Revenue: $7.94B
The table below shows earnings data. Earnings per share are non-GAAP.
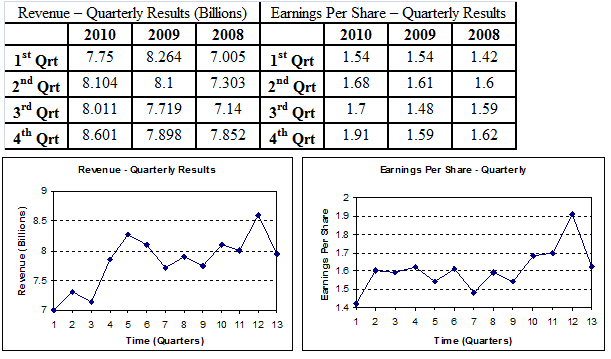
The graphs above include the earnings estimate which is placed in quarter 13 (the 13th quarter since the 1st quarter 2008). As one can see, both revenue and earnings are expected to fall hard. In fact, the decline is the steepest in the company’s last 12 quarters. Will this happen? Going back to the division data, it probably will not be that big of a cut.
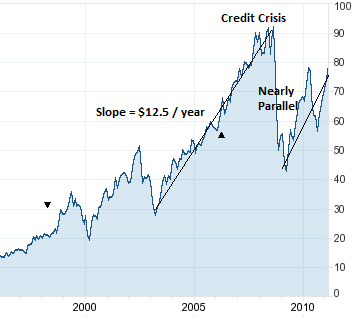
| The long term price chart of the stock shows a nearly straight line upward from 2003 till the credit crisis. But soon afterwards, it started to rise at nearly the same slope, rising about $12.5 a year. We assume the stock will continue rising at this pace at least till it hits the $90 mark, which is where it was just before the credit crisis. Taking that the price is currently $76, it will take about 1 year and 1.5 months to reach $90.
Source: Yahoo Finance |
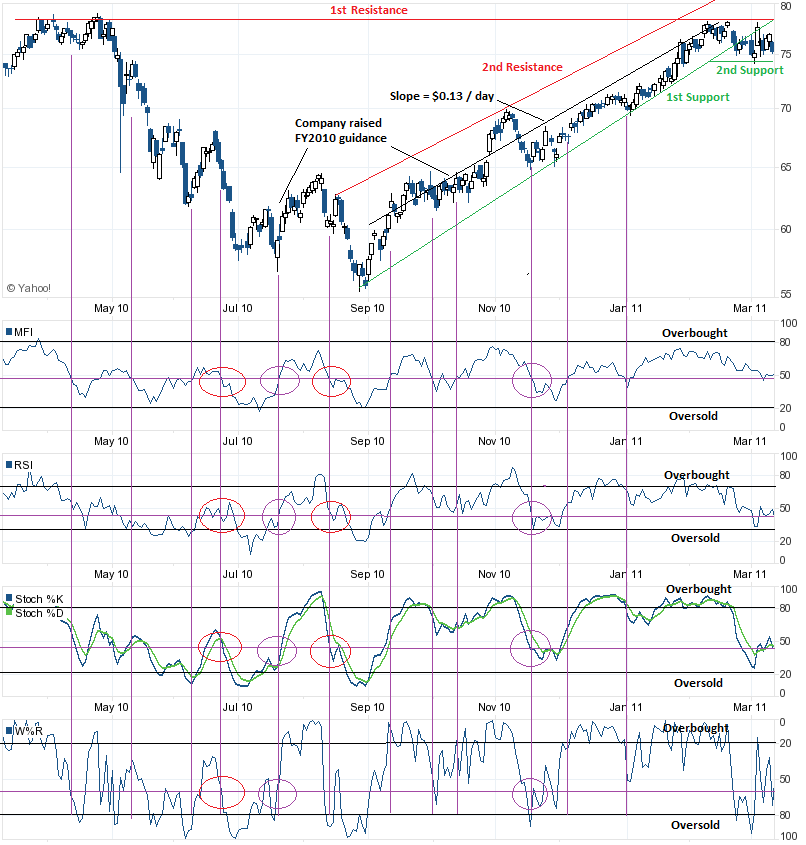
The technicals give mixed signals. All indicators (MFI, RSI, Stochastic %K and %D, and W%R) are between traditional overbought and oversold signals. Thus, there is no definite buy or sell signal. However, when drawing a line, shown in purple, from where the technicals are currently, one can see when prices had the same technical in the past. The vertical purple lines show every point where the MFI was at the same level. Three times all four technicals were at the same level at the same time. Two of these were followed by an increase in price. They are circled in purple. The other time was followed by a decrease in price. They are circled in red. And one other time, three of the technicals were at the same level at the same time. It was followed by a decrease in price, and thus is circled in red. Thus, one can say that the stock has slightly higher odds to move higher.
The price seemed to be moving in a price range upward. But in the last few weeks, the price has turned flat or even declined, forming a new support and resistance levels. If the price can break the newly formed 1st resistance line, it will meet resistance at its old 2nd resistance line. Assuming it climbs at about 13 cents a day, it will take 7 days to reach its 1st resistance line at $77 and, if it breaks it, 100 additional days before it reaches $90. But any upgrades could increase this time frame.
Source: Yahoo Finance
Written for momentumoptionstrading.com/