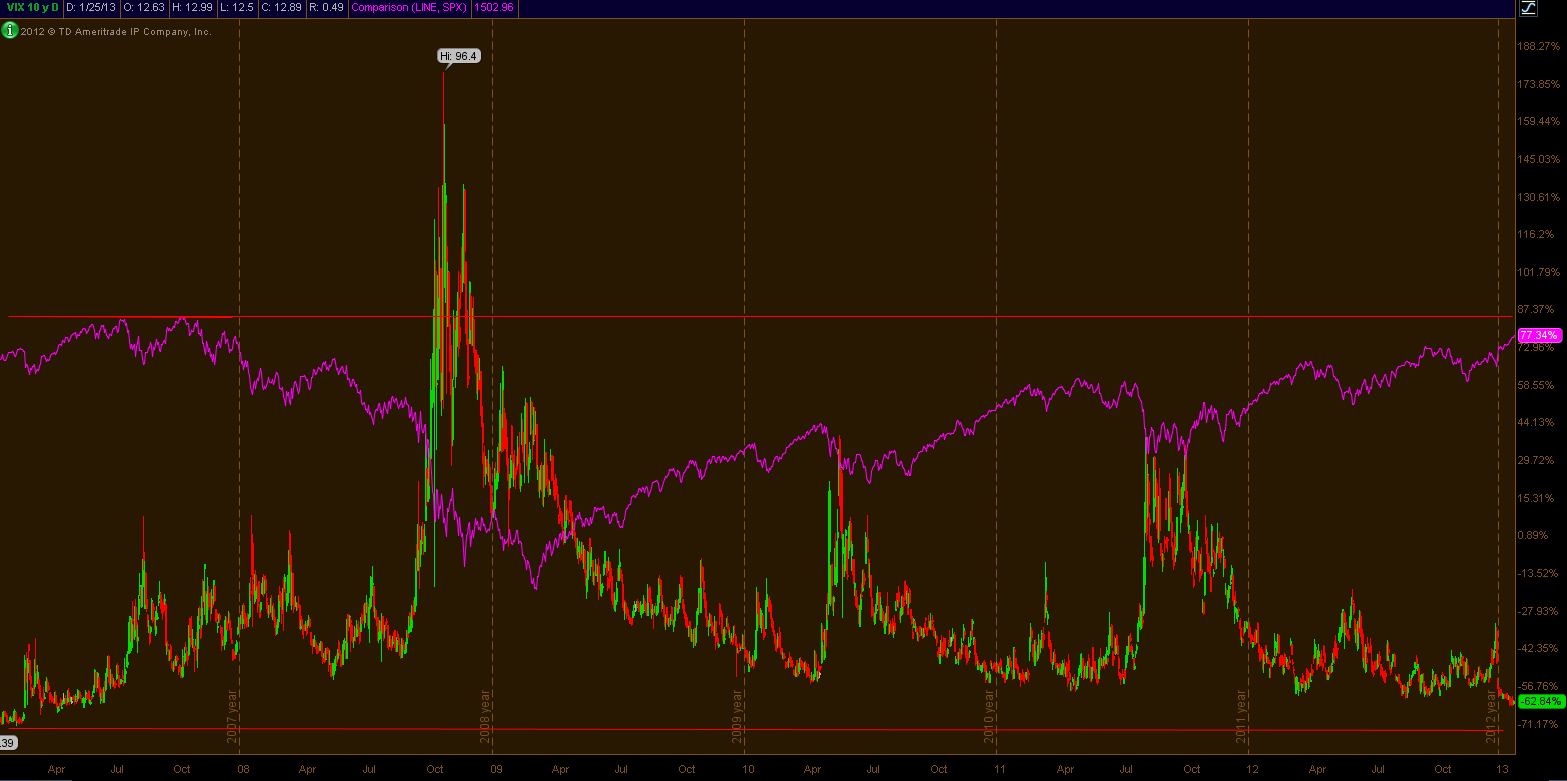
Long-Term Divergences Between The S&P (SPX) And Volatility (VIX)
Looking at a long-term chart - the 10YR Daily chart of the $VIX compared to $SPX, you will notice several defined divergences (Red-Green bars is the $VIX). Based on the divergence extremes, using the 2007 double top, and $VIX bottom at that point as the range, the current divergence has room to spread. Using Today's pricing with this range, the SPX could run up another 10%, and the $VIX could have another 9% of downside. Using this thesis on top of the total market sentiment, we could see 1650 in the $SPX, and the $VIX could bottom at ~11.50. Based on the 2007 run, this move would occur over the next 4 months.
#extremepredictions
The Fanvestor
Disclosure: I am long SPY. I wrote this article myself, and it expresses my own opinions. I am not receiving compensation for it. I have no business relationship with any company whose stock is mentioned in this article.
Additional disclosure: I am 60% Net Long the Market